|
Download Data (XLS File) |
|
||||||||
|
||||||||
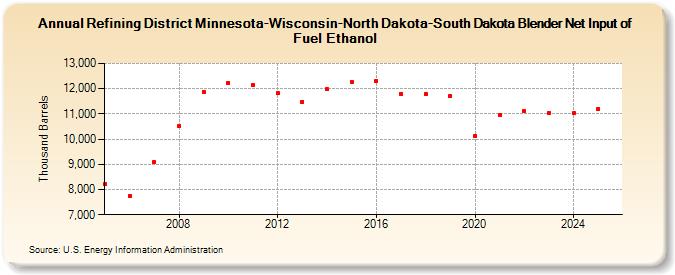
| Refining District Minnesota-Wisconsin-North Dakota-South Dakota Blender Net Input of Fuel Ethanol (Thousand Barrels) | ||||||||
| Decade | Year-0 | Year-1 | Year-2 | Year-3 | Year-4 | Year-5 | Year-6 | Year-7 | Year-8 | Year-9 |
|---|---|---|---|---|---|---|---|---|---|---|
| 2000's | 8,207 | 7,751 | 9,082 | 10,510 | 11,879 | |||||
| 2010's | 12,239 | 12,141 | 11,813 | 11,482 | 11,983 | 12,285 | 12,306 | 11,801 | 11,796 | 11,727 |
| 2020's | 10,128 | 10,948 | 11,103 | 11,031 |
| - = No Data Reported; -- = Not Applicable; NA = Not Available; W = Withheld to avoid disclosure of individual company data. |
| Release Date: 8/30/2024 |
| Next Release Date: 8/29/2025 |