|
Download Data (XLS File) |
|
||||||||
|
||||||||
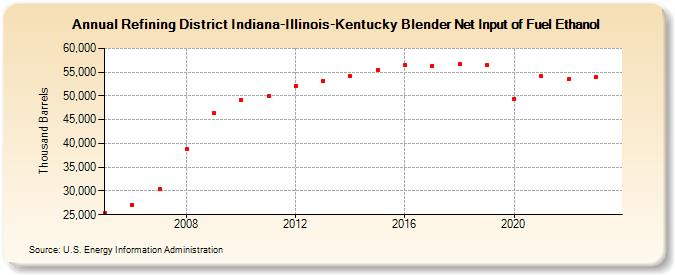
| Refining District Indiana-Illinois-Kentucky Blender Net Input of Fuel Ethanol (Thousand Barrels) | ||||||||
| Decade | Year-0 | Year-1 | Year-2 | Year-3 | Year-4 | Year-5 | Year-6 | Year-7 | Year-8 | Year-9 |
|---|---|---|---|---|---|---|---|---|---|---|
| 2000's | 25,305 | 27,147 | 30,425 | 38,725 | 46,449 | |||||
| 2010's | 49,161 | 49,928 | 52,064 | 53,101 | 54,092 | 55,541 | 56,501 | 56,346 | 56,655 | 56,414 |
| 2020's | 49,425 | 54,118 | 53,463 | 53,970 |
| - = No Data Reported; -- = Not Applicable; NA = Not Available; W = Withheld to avoid disclosure of individual company data. |
| Release Date: 8/30/2024 |
| Next Release Date: 8/29/2025 |