|
Download Data (XLS File) |
|
||||||||
|
||||||||
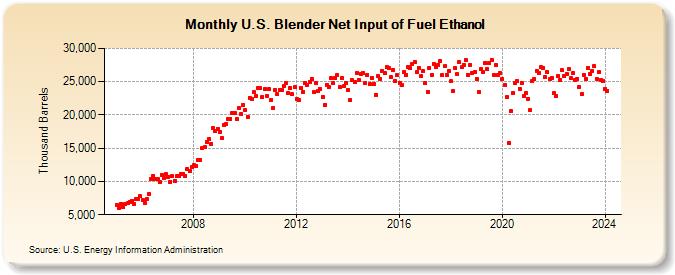
| U.S. Blender Net Input of Fuel Ethanol (Thousand Barrels) | ||||||||
| Year | Jan | Feb | Mar | Apr | May | Jun | Jul | Aug | Sep | Oct | Nov | Dec |
|---|---|---|---|---|---|---|---|---|---|---|---|---|
| 2005 | 6,432 | 6,004 | 6,675 | 6,139 | 6,539 | 6,696 | 6,970 | 7,102 | 6,537 | 7,300 | 7,323 | 7,768 |
| 2006 | 7,268 | 6,761 | 7,359 | 8,121 | 10,312 | 10,868 | 10,297 | 10,328 | 9,863 | 10,977 | 10,544 | 11,103 |
| 2007 | 10,714 | 9,963 | 10,753 | 10,086 | 10,750 | 10,793 | 11,070 | 11,168 | 10,824 | 11,872 | 11,638 | 12,179 |
| 2008 | 12,439 | 12,269 | 13,163 | 13,234 | 15,005 | 15,174 | 15,935 | 16,393 | 15,694 | 18,017 | 17,510 | 17,939 |
| 2009 | 17,469 | 16,537 | 18,526 | 18,633 | 19,404 | 19,459 | 20,214 | 20,238 | 19,418 | 21,081 | 20,167 | 21,531 |
| 2010 | 20,740 | 19,721 | 22,609 | 22,465 | 23,381 | 22,865 | 24,093 | 24,006 | 22,681 | 23,853 | 22,832 | 23,861 |
| 2011 | 22,290 | 21,055 | 23,768 | 23,108 | 23,800 | 23,780 | 24,323 | 24,826 | 23,287 | 24,029 | 23,101 | 24,140 |
| 2012 | 22,328 | 22,168 | 24,053 | 23,511 | 24,858 | 24,510 | 24,950 | 25,451 | 23,404 | 24,758 | 23,547 | 23,895 |
| 2013 | 22,748 | 21,523 | 24,562 | 24,158 | 25,527 | 24,833 | 25,517 | 26,004 | 24,141 | 25,613 | 24,340 | 24,842 |
| 2014 | 23,733 | 22,221 | 25,206 | 24,889 | 26,305 | 25,297 | 26,207 | 26,318 | 24,730 | 25,978 | 24,589 | 25,609 |
| 2015 | 24,717 | 23,038 | 25,777 | 25,420 | 26,637 | 26,233 | 27,141 | 27,112 | 25,692 | 26,735 | 25,029 | 25,959 |
| 2016 | 24,864 | 24,453 | 26,430 | 26,018 | 27,204 | 26,997 | 27,652 | 27,945 | 26,378 | 27,111 | 25,860 | 26,586 |
| 2017 | 24,801 | 23,434 | 27,019 | 26,049 | 27,701 | 27,220 | 27,552 | 28,078 | 25,946 | 27,292 | 26,009 | 26,635 |
| 2018 | 25,053 | 23,628 | 27,047 | 26,102 | 27,929 | 27,144 | 27,569 | 28,206 | 26,012 | 27,562 | 26,310 | 26,435 |
| 2019 | 25,394 | 23,419 | 26,831 | 26,396 | 27,817 | 26,899 | 27,852 | 28,282 | 26,050 | 27,539 | 26,072 | 26,282 |
| 2020 | 25,379 | 24,492 | 22,647 | 15,793 | 20,571 | 23,353 | 24,809 | 25,036 | 23,900 | 24,869 | 22,799 | 23,278 |
| 2021 | 22,462 | 20,670 | 25,113 | 25,336 | 26,641 | 26,310 | 27,194 | 27,092 | 25,661 | 26,420 | 25,387 | 25,595 |
| 2022 | 23,293 | 22,850 | 25,870 | 25,307 | 26,702 | 25,796 | 26,140 | 26,876 | 25,549 | 26,304 | 25,237 | 25,466 |
| 2023 | 24,256 | 23,108 | 26,057 | 25,465 | 27,090 | 26,167 | 26,617 | 27,281 | 25,402 | 26,472 | 25,241 | 25,106 |
| 2024 | 23,927 | 23,661 | ||||||||||
| - = No Data Reported; -- = Not Applicable; NA = Not Available; W = Withheld to avoid disclosure of individual company data. |
| Release Date: 4/30/2024 |
| Next Release Date: 5/31/2024 |
Referring Pages: