|
Download Data (XLS File) |
|
||||||||
|
||||||||
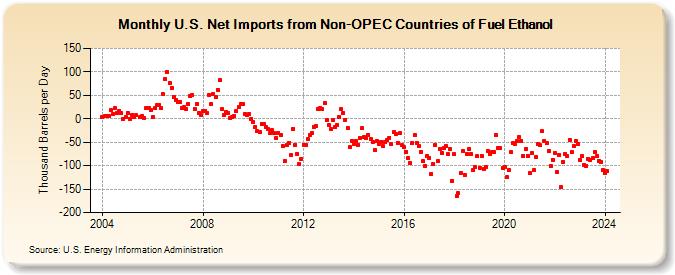
| U.S. Net Imports from Non-OPEC Countries of Fuel Ethanol (Thousand Barrels per Day) | ||||||||
| Year | Jan | Feb | Mar | Apr | May | Jun | Jul | Aug | Sep | Oct | Nov | Dec |
|---|---|---|---|---|---|---|---|---|---|---|---|---|
| 2004 | 4 | 5 | 5 | 6 | 18 | 11 | 22 | 13 | 17 | 12 | 0 | 3 |
| 2005 | 13 | 0 | 7 | 3 | 7 | 3 | 6 | 2 | 22 | 23 | 19 | |
| 2006 | 4 | 22 | 29 | 30 | 22 | 52 | 85 | 100 | 76 | 66 | 46 | 39 |
| 2007 | 35 | 36 | 23 | 24 | 21 | 31 | 49 | 51 | 20 | 32 | 13 | 7 |
| 2008 | 16 | 17 | 12 | 50 | 31 | 52 | 47 | 62 | 82 | 20 | 9 | 15 |
| 2009 | 13 | 2 | 3 | 6 | 16 | 24 | 31 | 32 | 10 | 9 | 10 | 0 |
| 2010 | -7 | -17 | -27 | -28 | -11 | -11 | -18 | -22 | -31 | -25 | -31 | -42 |
| 2011 | -30 | -34 | -58 | -91 | -56 | -51 | -78 | -21 | -56 | -75 | -97 | -85 |
| 2012 | -55 | -56 | -43 | -35 | -31 | -17 | -16 | 21 | 23 | 20 | 34 | -3 |
| 2013 | -13 | -22 | -2 | -18 | -13 | 4 | 20 | 13 | -2 | -19 | -61 | -47 |
| 2014 | -53 | -47 | -55 | -40 | -20 | -39 | -42 | -35 | -43 | -49 | -67 | -48 |
| 2015 | -53 | -49 | -59 | -50 | -45 | -40 | -54 | -29 | -33 | -51 | -31 | -57 |
| 2016 | -61 | -70 | -84 | -94 | -52 | -35 | -51 | -59 | -70 | -91 | -101 | -79 |
| 2017 | -83 | -117 | -97 | -56 | -91 | -65 | -73 | -63 | -59 | -76 | -64 | -132 |
| 2018 | -76 | -165 | -159 | -116 | -69 | -119 | -75 | -65 | -76 | -109 | -103 | -80 |
| 2019 | -104 | -79 | -107 | -102 | -69 | -76 | -70 | -71 | -35 | -62 | -63 | -104 |
| 2020 | -102 | -125 | -109 | -71 | -52 | -54 | -48 | -39 | -47 | -79 | -64 | -79 |
| 2021 | -116 | -74 | -109 | -82 | -54 | -56 | -27 | -47 | -52 | -68 | -100 | -87 |
| 2022 | -73 | -114 | -77 | -146 | -92 | -76 | -80 | -45 | -71 | -58 | -47 | -54 |
| 2023 | -88 | -80 | -99 | -100 | -85 | -87 | -84 | -71 | -80 | -90 | -92 | -110 |
| 2024 | -115 | |||||||||||
| - = No Data Reported; -- = Not Applicable; NA = Not Available; W = Withheld to avoid disclosure of individual company data. |
| Release Date: 3/29/2024 |
| Next Release Date: 4/30/2024 |