|
Download Data (XLS File) |
|
||||||||
|
||||||||
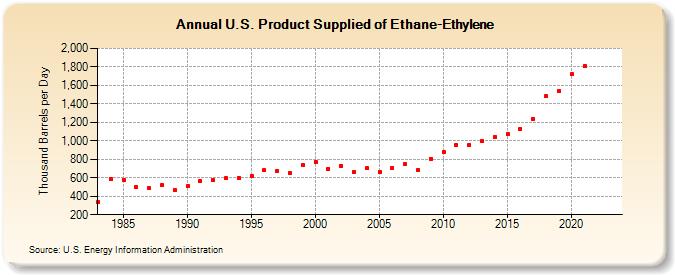
| U.S. Product Supplied of Ethane-Ethylene (Thousand Barrels per Day) | ||||||||
| Decade | Year-0 | Year-1 | Year-2 | Year-3 | Year-4 | Year-5 | Year-6 | Year-7 | Year-8 | Year-9 |
|---|---|---|---|---|---|---|---|---|---|---|
| 1980's | 334 | 588 | 575 | 495 | 486 | 520 | 465 | |||
| 1990's | 510 | 569 | 574 | 594 | 598 | 623 | 683 | 676 | 650 | 735 |
| 2000's | 774 | 695 | 725 | 663 | 702 | 660 | 707 | 744 | 685 | 807 |
| 2010's | 880 | 954 | 955 | 996 | 1,042 | 1,075 | 1,130 | 1,241 | 1,480 | 1,537 |
| 2020's | 1,718 | 1,808 | -- | -- |
| - = No Data Reported; -- = Not Applicable; NA = Not Available; W = Withheld to avoid disclosure of individual company data. |
| Release Date: 3/29/2024 |
| Next Release Date: 8/30/2024 |