|
Download Data (XLS File) |
|
||||||||
|
||||||||
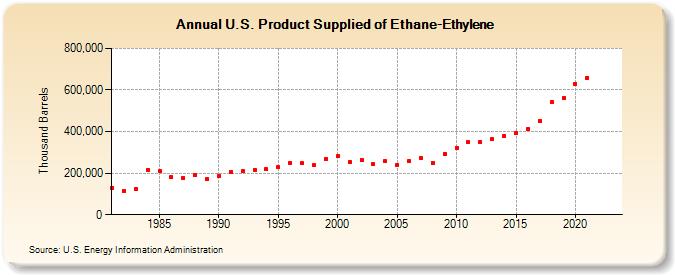
| U.S. Product Supplied of Ethane-Ethylene (Thousand Barrels) | ||||||||
| Decade | Year-0 | Year-1 | Year-2 | Year-3 | Year-4 | Year-5 | Year-6 | Year-7 | Year-8 | Year-9 |
|---|---|---|---|---|---|---|---|---|---|---|
| 1980's | 128,038 | 115,466 | 121,910 | 215,288 | 209,730 | 180,602 | 177,507 | 190,390 | 169,562 | |
| 1990's | 186,217 | 207,841 | 209,914 | 216,666 | 218,344 | 227,479 | 250,007 | 246,824 | 237,220 | 268,360 |
| 2000's | 283,329 | 253,646 | 264,755 | 242,018 | 256,951 | 240,792 | 258,108 | 271,540 | 250,783 | 294,408 |
| 2010's | 321,189 | 348,358 | 349,499 | 363,511 | 380,489 | 392,368 | 413,667 | 452,985 | 540,021 | 561,005 |
| 2020's | 628,961 | 659,790 | -- | -- |
| - = No Data Reported; -- = Not Applicable; NA = Not Available; W = Withheld to avoid disclosure of individual company data. |
| Release Date: 3/29/2024 |
| Next Release Date: 8/30/2024 |