|
Download Data (XLS File) |
|
||||||||
|
||||||||
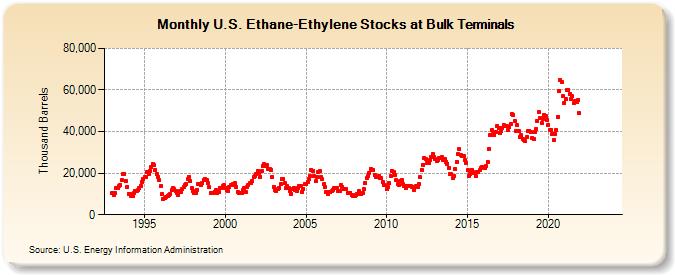
| U.S. Ethane-Ethylene Stocks at Bulk Terminals (Thousand Barrels) | ||||||||
| Year | Jan | Feb | Mar | Apr | May | Jun | Jul | Aug | Sep | Oct | Nov | Dec |
|---|---|---|---|---|---|---|---|---|---|---|---|---|
| 1993 | 10,335 | 9,416 | 10,412 | 12,725 | 12,693 | 13,587 | 14,307 | 16,625 | 19,617 | 19,583 | 16,282 | 13,487 |
| 1994 | 10,015 | 10,179 | 8,830 | 9,074 | 10,464 | 11,242 | 11,480 | 11,721 | 12,851 | 14,008 | 15,863 | 17,286 |
| 1995 | 18,142 | 18,257 | 20,315 | 19,627 | 21,100 | 22,716 | 24,534 | 23,768 | 21,626 | 19,436 | 18,168 | 16,504 |
| 1996 | 13,749 | 10,183 | 7,561 | 7,814 | 8,718 | 9,103 | 9,381 | 9,730 | 11,666 | 13,027 | 12,486 | 11,556 |
| 1997 | 10,579 | 9,452 | 11,367 | 11,150 | 12,142 | 13,289 | 14,266 | 14,778 | 17,021 | 18,092 | 16,191 | 12,873 |
| 1998 | 11,401 | 10,377 | 10,518 | 12,117 | 14,743 | 14,787 | 14,448 | 15,130 | 16,700 | 17,418 | 16,516 | 15,143 |
| 1999 | 13,090 | 10,411 | 10,588 | 10,497 | 11,148 | 11,834 | 10,668 | 10,877 | 12,930 | 12,976 | 13,878 | 14,119 |
| 2000 | 12,929 | 11,694 | 11,444 | 13,345 | 14,176 | 14,098 | 14,918 | 15,102 | 13,415 | 11,028 | 10,250 | 10,532 |
| 2001 | 10,301 | 11,763 | 12,648 | 10,832 | 13,354 | 14,317 | 15,101 | 15,302 | 16,227 | 18,130 | 18,571 | 19,481 |
| 2002 | 21,137 | 20,015 | 18,322 | 20,972 | 23,438 | 24,253 | 23,486 | 23,713 | 22,184 | 22,033 | 21,474 | 18,170 |
| 2003 | 13,514 | 11,668 | 11,277 | 12,311 | 12,949 | 14,592 | 17,177 | 17,196 | 15,175 | 12,656 | 13,663 | 12,851 |
| 2004 | 11,486 | 10,060 | 12,564 | 12,953 | 11,733 | 11,293 | 12,963 | 14,040 | 14,007 | 10,940 | 12,476 | 14,923 |
| 2005 | 14,607 | 15,633 | 17,027 | 18,707 | 21,539 | 21,221 | 18,483 | 16,127 | 18,193 | 20,728 | 21,036 | 18,291 |
| 2006 | 16,953 | 14,645 | 13,367 | 10,935 | 10,065 | 11,013 | 10,730 | 11,346 | 12,122 | 12,888 | 12,868 | 12,980 |
| 2007 | 11,497 | 11,593 | 14,259 | 13,432 | 12,572 | 12,247 | 12,128 | 10,582 | 10,458 | 10,656 | 9,456 | 8,837 |
| 2008 | 9,148 | 9,625 | 9,855 | 11,376 | 9,984 | 9,803 | 10,650 | 12,161 | 15,179 | 17,438 | 18,425 | 20,154 |
| 2009 | 22,161 | 21,535 | 21,645 | 19,077 | 18,219 | 18,248 | 18,390 | 17,493 | 17,643 | 15,780 | 14,125 | 14,161 |
| 2010 | 12,235 | 13,173 | 15,052 | 18,533 | 21,050 | 20,385 | 18,976 | 16,565 | 14,551 | 14,385 | 16,395 | 16,701 |
| 2011 | 14,556 | 14,029 | 12,854 | 13,603 | 14,012 | 13,705 | 13,614 | 13,126 | 11,804 | 13,366 | 13,709 | 13,111 |
| 2012 | 14,832 | 17,905 | 21,725 | 24,064 | 27,176 | 26,581 | 24,664 | 24,684 | 26,257 | 27,885 | 29,297 | 27,991 |
| 2013 | 26,766 | 25,755 | 26,185 | 27,291 | 27,224 | 27,608 | 26,351 | 26,674 | 25,578 | 24,612 | 22,516 | 19,795 |
| 2014 | 19,432 | 17,600 | 18,545 | 21,938 | 25,523 | 29,217 | 31,472 | 28,810 | 28,344 | 28,355 | 26,122 | 24,667 |
| 2015 | 21,346 | 18,851 | 19,792 | 21,564 | 20,533 | 19,906 | 18,620 | 20,652 | 20,514 | 21,314 | 22,595 | 22,734 |
| 2016 | 22,754 | 22,287 | 23,528 | 25,373 | 31,686 | 38,138 | 40,817 | 38,933 | 38,528 | 40,015 | 42,649 | 41,487 |
| 2017 | 39,388 | 40,315 | 41,711 | 43,240 | 42,446 | 42,529 | 40,969 | 42,188 | 43,646 | 48,329 | 47,994 | 44,901 |
| 2018 | 40,474 | 43,043 | 40,266 | 37,234 | 38,177 | 36,489 | 36,072 | 35,260 | 37,304 | 40,080 | 40,492 | 39,756 |
| 2019 | 36,995 | 36,557 | 39,989 | 41,343 | 45,155 | 49,420 | 46,572 | 44,109 | 46,147 | 48,177 | 47,636 | 45,787 |
| 2020 | 43,390 | 40,547 | 40,852 | 38,794 | 35,896 | 38,805 | 40,647 | 47,225 | 59,306 | 64,636 | 63,759 | 56,915 |
| 2021 | 53,779 | 55,419 | 59,929 | 60,002 | 58,102 | 55,597 | 56,966 | 53,676 | 54,745 | 54,024 | 54,977 | 48,975 |
| 2022 | -- | -- | -- | -- | -- | -- | -- | -- | -- | -- | -- | -- |
| 2023 | -- | -- | -- | -- | -- | -- | -- | -- | -- | -- | -- | -- |
| 2024 | -- | |||||||||||
| - = No Data Reported; -- = Not Applicable; NA = Not Available; W = Withheld to avoid disclosure of individual company data. |
| Release Date: 3/29/2024 |
| Next Release Date: 4/30/2024 |