|
Download Data (XLS File) |
|
||||||||
|
||||||||
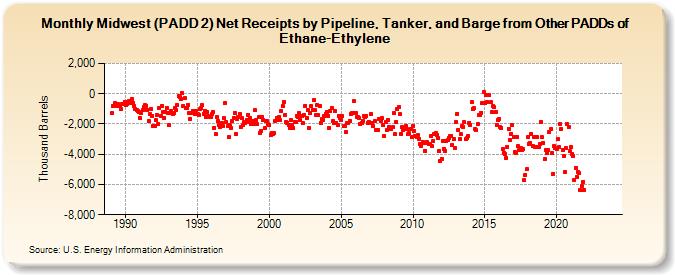
| Midwest (PADD 2) Net Receipts by Pipeline, Tanker, and Barge from Other PADDs of Ethane-Ethylene (Thousand Barrels) | ||||||||
| Year | Jan | Feb | Mar | Apr | May | Jun | Jul | Aug | Sep | Oct | Nov | Dec |
|---|---|---|---|---|---|---|---|---|---|---|---|---|
| 1989 | -1,292 | -802 | -805 | -634 | -823 | -649 | -786 | -817 | -1,023 | -708 | -705 | -537 |
| 1990 | -765 | -702 | -574 | -488 | -624 | -355 | -584 | -788 | -989 | -1,065 | -1,127 | -1,203 |
| 1991 | -1,621 | -1,273 | -1,074 | -887 | -759 | -794 | -1,051 | -1,813 | -1,349 | -990 | -1,448 | -2,108 |
| 1992 | -2,137 | -1,766 | -1,402 | -1,994 | -935 | -1,465 | -805 | -1,193 | -1,602 | -1,210 | -921 | -1,275 |
| 1993 | -2,095 | -1,279 | -1,166 | -1,360 | -1,262 | -928 | -1,053 | -750 | -171 | -213 | -340 | 52 |
| 1994 | -790 | -283 | -925 | -920 | -723 | -1,292 | -1,670 | -1,249 | -1,142 | -1,170 | -1,361 | -1,150 |
| 1995 | -1,367 | -1,374 | -986 | -966 | -773 | -1,308 | -1,110 | -1,566 | -1,195 | -1,476 | -1,512 | -1,512 |
| 1996 | -1,340 | -1,230 | -2,249 | -2,690 | -1,529 | -1,776 | -2,071 | -2,186 | -1,906 | -2,156 | -1,615 | -624 |
| 1997 | -1,878 | -2,142 | -2,859 | -2,094 | -2,265 | -1,779 | -1,613 | -1,244 | -2,663 | -1,666 | -1,524 | -1,313 |
| 1998 | -2,215 | -1,636 | -2,041 | -1,849 | -1,929 | -1,744 | -1,390 | -1,837 | -1,633 | -2,031 | -1,807 | -2,010 |
| 1999 | -1,108 | -1,719 | -2,028 | -1,555 | -2,569 | -2,443 | -1,534 | -1,728 | -2,276 | -1,831 | -1,835 | -1,999 |
| 2000 | -2,075 | -2,736 | -2,626 | -2,630 | -2,614 | -1,797 | -1,593 | -1,734 | -1,537 | -1,762 | -1,131 | -801 |
| 2001 | -524 | -1,398 | -1,844 | -1,925 | -2,060 | -2,270 | -1,742 | -2,076 | -2,267 | -1,856 | -1,863 | -1,443 |
| 2002 | -1,535 | -1,305 | -1,734 | -1,501 | -1,965 | -1,418 | -793 | -1,620 | -1,064 | -2,247 | -1,280 | -812 |
| 2003 | -1,059 | -433 | -1,061 | -1,419 | -750 | -1,421 | -833 | -1,912 | -1,700 | -1,722 | -1,489 | -1,354 |
| 2004 | -1,178 | -1,455 | -2,261 | -1,144 | -950 | -1,831 | -1,947 | -1,144 | -1,909 | -2,089 | -1,485 | -1,591 |
| 2005 | -1,768 | -1,467 | -2,157 | -2,153 | -2,529 | -1,943 | -1,917 | -1,803 | -1,329 | -1,255 | -1,283 | -500 |
| 2006 | -1,265 | -1,569 | -1,510 | -1,605 | -2,008 | -1,909 | -1,795 | -1,477 | -1,557 | -1,467 | -1,942 | -1,840 |
| 2007 | -1,915 | -1,335 | -1,918 | -2,137 | -1,796 | -2,376 | -2,381 | -2,390 | -1,685 | -1,815 | -1,636 | -2,085 |
| 2008 | -2,797 | -1,868 | -2,374 | -1,708 | -2,171 | -2,311 | -2,310 | -2,219 | -1,287 | -2,680 | -1,843 | -1,019 |
| 2009 | -881 | -1,363 | -2,637 | -2,210 | -2,417 | -2,234 | -2,112 | -2,334 | -2,679 | -2,614 | -2,305 | -2,890 |
| 2010 | -2,120 | -2,488 | -2,809 | -2,869 | -2,761 | -2,975 | -3,299 | -3,444 | -3,192 | -3,281 | -3,785 | -3,226 |
| 2011 | -3,215 | -3,331 | -3,321 | -2,800 | -3,486 | -3,097 | -2,655 | -2,565 | -2,735 | -2,900 | -3,812 | -4,461 |
| 2012 | -4,287 | -3,104 | -3,638 | -3,761 | -3,128 | -3,066 | -2,901 | -2,796 | -2,798 | -3,391 | -2,963 | -3,602 |
| 2013 | -1,871 | -1,322 | -2,389 | -2,983 | -2,686 | -2,118 | -2,186 | -1,888 | -3,013 | -2,953 | -2,791 | -1,903 |
| 2014 | -2,037 | -554 | -979 | -958 | -2,314 | -2,417 | -1,992 | -1,430 | -1,390 | -1,251 | -599 | 108 |
| 2015 | -617 | -98 | -537 | -108 | -115 | -569 | -1,227 | -794 | -895 | -1,226 | -2,050 | -1,744 |
| 2016 | -1,647 | -2,169 | -2,238 | -3,677 | -3,891 | -3,989 | -4,237 | -3,515 | -2,331 | -3,049 | -2,665 | -2,092 |
| 2017 | -2,868 | -3,853 | -3,929 | -2,853 | -3,489 | -3,745 | -3,569 | -3,692 | -3,680 | -5,728 | -5,346 | -5,001 |
| 2018 | -2,879 | -3,301 | -3,273 | -2,645 | -3,487 | -2,843 | -3,505 | -3,514 | -2,890 | -3,508 | -3,321 | -1,848 |
| 2019 | -2,883 | -3,231 | -4,347 | -3,723 | -3,947 | -3,713 | -2,529 | -2,364 | -3,925 | -5,298 | -3,464 | -3,559 |
| 2020 | -3,623 | -3,012 | -3,554 | -2,017 | -2,342 | -3,695 | -4,095 | -5,167 | -3,600 | -1,990 | -2,181 | -3,819 |
| 2021 | -3,542 | -3,981 | -4,126 | -5,716 | -4,911 | -5,495 | -5,180 | -5,260 | -6,395 | -6,119 | -5,815 | -6,363 |
| 2022 | -- | -- | -- | -- | -- | -- | -- | -- | -- | -- | -- | -- |
| 2023 | -- | -- | -- | -- | -- | -- | -- | -- | -- | -- | -- | -- |
| 2024 | -- | |||||||||||
| - = No Data Reported; -- = Not Applicable; NA = Not Available; W = Withheld to avoid disclosure of individual company data. |
| Release Date: 3/29/2024 |
| Next Release Date: 4/30/2024 |