|
Download Data (XLS File) |
|
||||||||
|
||||||||
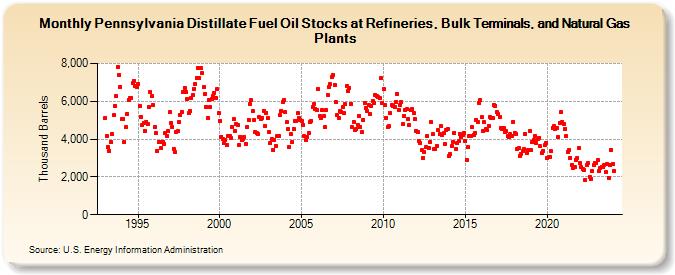
| Pennsylvania Distillate Fuel Oil Stocks at Refineries, Bulk Terminals, and Natural Gas Plants (Thousand Barrels) | ||||||||
| Year | Jan | Feb | Mar | Apr | May | Jun | Jul | Aug | Sep | Oct | Nov | Dec |
|---|---|---|---|---|---|---|---|---|---|---|---|---|
| 1993 | 5,113 | 4,163 | 3,579 | 3,396 | 3,846 | 4,268 | 5,268 | 5,749 | 6,279 | 7,824 | 7,390 | 6,765 |
| 1994 | 5,039 | 5,060 | 3,853 | 4,624 | 5,336 | 6,086 | 6,167 | 6,175 | 6,958 | 7,096 | 6,821 | 6,768 |
| 1995 | 6,893 | 5,740 | 5,192 | 4,754 | 4,839 | 4,443 | 4,928 | 4,810 | 5,705 | 6,488 | 6,256 | 5,803 |
| 1996 | 4,628 | 4,307 | 3,371 | 3,827 | 3,854 | 3,508 | 3,832 | 3,767 | 4,305 | 4,185 | 4,443 | 5,415 |
| 1997 | 4,865 | 4,640 | 3,496 | 3,328 | 4,400 | 4,412 | 4,890 | 5,259 | 5,456 | 6,498 | 6,726 | 6,486 |
| 1998 | 6,133 | 5,373 | 5,474 | 6,155 | 6,328 | 6,666 | 6,915 | 7,256 | 7,756 | 7,215 | 7,768 | 7,484 |
| 1999 | 6,739 | 6,377 | 5,714 | 5,121 | 6,070 | 5,698 | 6,113 | 6,300 | 6,461 | 6,182 | 6,636 | 5,372 |
| 2000 | 4,959 | 4,134 | 4,026 | 3,795 | 3,964 | 3,704 | 4,138 | 4,157 | 4,073 | 4,654 | 5,038 | 4,438 |
| 2001 | 4,810 | 4,730 | 3,706 | 4,119 | 3,935 | 4,015 | 4,100 | 3,756 | 4,642 | 5,028 | 5,840 | 6,059 |
| 2002 | 5,466 | 5,028 | 4,383 | 4,321 | 4,296 | 5,169 | 5,048 | 5,138 | 5,490 | 4,698 | 5,399 | 5,102 |
| 2003 | 4,359 | 3,795 | 3,990 | 3,442 | 3,970 | 3,654 | 4,145 | 4,161 | 5,266 | 5,504 | 5,965 | 6,064 |
| 2004 | 5,419 | 4,903 | 4,520 | 3,599 | 4,285 | 3,825 | 4,534 | 4,969 | 4,978 | 5,355 | 5,135 | 5,024 |
| 2005 | 4,982 | 4,744 | 4,148 | 3,926 | 4,130 | 4,332 | 4,926 | 4,971 | 5,676 | 5,851 | 5,616 | 5,552 |
| 2006 | 6,654 | 5,231 | 5,117 | 5,523 | 5,220 | 4,623 | 5,521 | 6,339 | 6,777 | 6,919 | 7,299 | 7,415 |
| 2007 | 6,876 | 5,955 | 5,261 | 5,125 | 5,491 | 5,454 | 5,685 | 5,370 | 5,848 | 6,830 | 6,550 | 6,721 |
| 2008 | 5,873 | 4,621 | 4,926 | 4,487 | 4,535 | 4,751 | 5,219 | 4,631 | 4,359 | 5,029 | 5,906 | 5,646 |
| 2009 | 5,467 | 5,816 | 5,334 | 5,748 | 6,002 | 5,919 | 6,331 | 6,260 | 6,221 | 6,160 | 7,214 | 5,925 |
| 2010 | 6,633 | 5,793 | 5,132 | 4,628 | 4,674 | 5,380 | 5,811 | 5,773 | 5,715 | 5,963 | 6,374 | 5,553 |
| 2011 | 5,797 | 5,957 | 4,788 | 5,235 | 5,522 | 5,577 | 5,050 | 4,741 | 5,530 | 5,582 | 5,357 | 5,069 |
| 2012 | 4,454 | 4,386 | 3,874 | 3,773 | 3,400 | 3,016 | 3,317 | 3,557 | 4,177 | 3,512 | 3,853 | 4,904 |
| 2013 | 4,244 | 3,469 | 3,467 | 3,658 | 4,456 | 4,265 | 4,671 | 4,234 | 4,301 | 3,740 | 4,494 | 4,542 |
| 2014 | 3,086 | 3,199 | 3,640 | 3,869 | 4,331 | 3,477 | 3,790 | 3,892 | 4,295 | 4,087 | 4,209 | 4,326 |
| 2015 | 3,896 | 2,890 | 3,579 | 4,143 | 4,146 | 4,638 | 4,233 | 4,339 | 5,028 | 4,930 | 5,916 | 6,043 |
| 2016 | 5,147 | 4,438 | 4,885 | 4,525 | 4,476 | 4,702 | 5,181 | 5,135 | 5,130 | 5,823 | 5,774 | 5,433 |
| 2017 | 5,316 | 5,145 | 4,591 | 4,559 | 4,609 | 4,372 | 4,405 | 4,167 | 4,089 | 4,260 | 4,140 | 4,925 |
| 2018 | 4,346 | 4,289 | 3,452 | 3,509 | 3,123 | 3,225 | 3,383 | 3,468 | 4,293 | 3,271 | 3,420 | 4,406 |
| 2019 | 3,410 | 3,825 | 3,943 | 4,171 | 3,801 | 3,988 | 4,072 | 3,613 | 3,262 | 3,385 | 3,666 | 3,782 |
| 2020 | 3,017 | 3,034 | 3,071 | 3,350 | 4,607 | 4,669 | 4,549 | 4,612 | 4,115 | 4,865 | 5,431 | 4,906 |
| 2021 | 4,794 | 4,546 | 4,150 | 3,342 | 3,431 | 3,022 | 2,635 | 2,446 | 2,506 | 2,914 | 3,007 | 3,526 |
| 2022 | 2,730 | 2,523 | 2,440 | 2,365 | 1,842 | 2,629 | 2,719 | 2,020 | 1,893 | 2,298 | 2,619 | 2,762 |
| 2023 | 2,761 | 2,879 | 2,301 | 2,477 | 2,541 | 2,544 | 2,620 | 2,253 | 2,683 | 1,960 | 2,606 | 3,421 |
| 2024 | 2,692 | |||||||||||
| - = No Data Reported; -- = Not Applicable; NA = Not Available; W = Withheld to avoid disclosure of individual company data. |
| Release Date: 3/29/2024 |
| Next Release Date: 4/30/2024 |