|
Download Data (XLS File) |
|
||||||||
|
||||||||
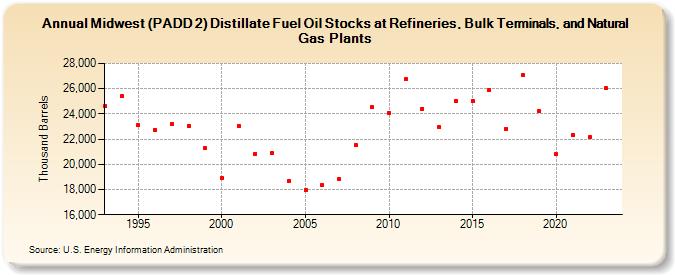
| Midwest (PADD 2) Distillate Fuel Oil Stocks at Refineries, Bulk Terminals, and Natural Gas Plants (Thousand Barrels) | ||||||||
| Decade | Year-0 | Year-1 | Year-2 | Year-3 | Year-4 | Year-5 | Year-6 | Year-7 | Year-8 | Year-9 |
|---|---|---|---|---|---|---|---|---|---|---|
| 1990's | 24,616 | 25,388 | 23,083 | 22,743 | 23,176 | 23,020 | 21,260 | |||
| 2000's | 18,917 | 23,067 | 20,838 | 20,860 | 18,651 | 17,945 | 18,344 | 18,873 | 21,537 | 24,509 |
| 2010's | 24,094 | 26,733 | 24,414 | 22,946 | 25,057 | 25,004 | 25,926 | 22,835 | 27,097 | 24,209 |
| 2020's | 20,813 | 22,309 | 22,138 | 26,030 |
| - = No Data Reported; -- = Not Applicable; NA = Not Available; W = Withheld to avoid disclosure of individual company data. |
| Release Date: 3/29/2024 |
| Next Release Date: 8/30/2024 |