|
Download Data (XLS File) |
|
||||||||
|
||||||||
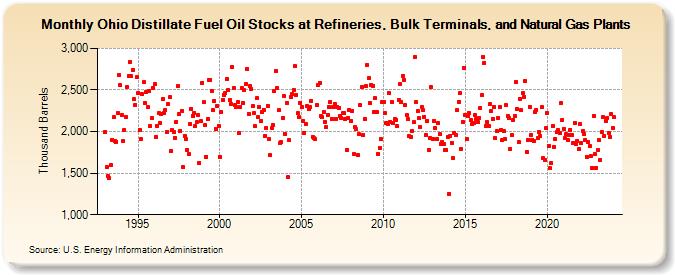
| Ohio Distillate Fuel Oil Stocks at Refineries, Bulk Terminals, and Natural Gas Plants (Thousand Barrels) | ||||||||
| Year | Jan | Feb | Mar | Apr | May | Jun | Jul | Aug | Sep | Oct | Nov | Dec |
|---|---|---|---|---|---|---|---|---|---|---|---|---|
| 1993 | 1,989 | 1,572 | 1,469 | 1,440 | 1,594 | 1,902 | 2,171 | 1,883 | 1,878 | 2,222 | 2,678 | 2,556 |
| 1994 | 2,194 | 1,884 | 2,016 | 2,178 | 2,537 | 2,672 | 2,837 | 2,663 | 2,742 | 2,391 | 2,324 | 2,650 |
| 1995 | 2,465 | 2,017 | 1,910 | 2,447 | 2,592 | 2,347 | 2,476 | 2,295 | 2,485 | 2,066 | 2,163 | 2,527 |
| 1996 | 2,566 | 1,940 | 2,067 | 2,218 | 2,098 | 2,217 | 2,396 | 2,228 | 2,258 | 1,996 | 2,326 | 2,412 |
| 1997 | 1,771 | 2,015 | 2,000 | 1,928 | 2,119 | 2,550 | 2,211 | 2,004 | 2,248 | 1,571 | 1,948 | 1,906 |
| 1998 | 1,778 | 1,725 | 2,086 | 2,276 | 2,189 | 2,226 | 2,062 | 2,110 | 2,196 | 1,622 | 2,123 | 2,587 |
| 1999 | 2,352 | 2,074 | 1,697 | 2,150 | 2,621 | 2,623 | 2,493 | 2,255 | 2,367 | 2,033 | 2,307 | 2,066 |
| 2000 | 1,700 | 2,231 | 2,377 | 2,437 | 2,465 | 2,630 | 2,501 | 2,378 | 2,326 | 2,774 | 2,525 | 2,315 |
| 2001 | 2,300 | 2,357 | 1,984 | 2,301 | 2,526 | 2,343 | 2,494 | 2,574 | 2,755 | 2,217 | 2,548 | 2,514 |
| 2002 | 2,306 | 2,218 | 2,062 | 2,399 | 2,171 | 2,293 | 2,131 | 2,241 | 2,265 | 1,948 | 2,042 | 2,311 |
| 2003 | 1,910 | 1,717 | 2,046 | 2,074 | 2,492 | 2,730 | 2,528 | 2,256 | 1,859 | 1,872 | 2,163 | 2,426 |
| 2004 | 1,971 | 2,349 | 1,449 | 1,894 | 2,419 | 2,448 | 2,501 | 2,784 | 2,440 | 2,219 | 2,171 | 2,347 |
| 2005 | 2,291 | 2,130 | 1,986 | 2,089 | 2,303 | 2,277 | 2,293 | 2,371 | 1,939 | 1,919 | 1,909 | 2,321 |
| 2006 | 2,562 | 2,588 | 2,185 | 2,173 | 2,241 | 2,115 | 2,050 | 2,201 | 2,297 | 2,361 | 2,152 | 2,295 |
| 2007 | 2,335 | 2,154 | 2,299 | 2,281 | 2,192 | 2,166 | 2,218 | 2,223 | 2,152 | 1,782 | 2,167 | 2,260 |
| 2008 | 2,132 | 2,251 | 1,728 | 2,056 | 2,029 | 1,716 | 1,965 | 2,316 | 2,537 | 1,958 | 2,148 | 2,546 |
| 2009 | 2,801 | 2,643 | 2,345 | 2,558 | 2,548 | 2,238 | 2,401 | 2,238 | 1,728 | 1,804 | 1,908 | 2,352 |
| 2010 | 2,356 | 2,222 | 2,104 | 2,095 | 2,460 | 2,117 | 2,357 | 2,101 | 2,156 | 2,142 | 2,065 | 2,380 |
| 2011 | 2,566 | 2,353 | 2,670 | 2,625 | 2,319 | 2,196 | 2,148 | 1,946 | 1,939 | 2,004 | 2,109 | 2,899 |
| 2012 | 2,351 | 2,248 | 2,160 | 2,054 | 2,294 | 2,256 | 2,178 | 1,961 | 2,129 | 1,776 | 1,922 | 2,530 |
| 2013 | 1,909 | 2,130 | 2,038 | 1,908 | 2,107 | 1,970 | 1,851 | 1,876 | 1,853 | 1,774 | 1,776 | 1,938 |
| 2014 | 1,253 | 1,952 | 1,866 | 1,677 | 1,977 | 1,961 | 2,259 | 2,360 | 2,458 | 1,786 | 2,114 | 2,769 |
| 2015 | 2,198 | 1,913 | 2,187 | 2,220 | 2,135 | 2,088 | 2,104 | 2,201 | 2,146 | 2,117 | 2,166 | 2,286 |
| 2016 | 2,435 | 2,898 | 2,827 | 2,065 | 2,112 | 2,071 | 2,328 | 2,245 | 2,154 | 2,300 | 1,925 | 2,005 |
| 2017 | 2,168 | 2,298 | 2,017 | 1,893 | 2,009 | 1,911 | 2,314 | 2,187 | 2,159 | 1,789 | 1,956 | 2,144 |
| 2018 | 2,186 | 2,597 | 2,277 | 1,874 | 2,392 | 2,255 | 2,462 | 2,418 | 2,606 | 1,759 | 1,898 | 2,301 |
| 2019 | 1,956 | 1,904 | 1,881 | 2,236 | 2,265 | 1,921 | 1,992 | 1,949 | 2,293 | 1,677 | 1,663 | 2,040 |
| 2020 | 2,221 | 1,831 | 1,558 | 1,616 | 2,067 | 1,818 | 1,912 | 1,991 | 2,018 | 1,986 | 2,338 | 2,142 |
| 2021 | 2,032 | 1,921 | 1,965 | 1,898 | 1,961 | 2,024 | 1,962 | 1,865 | 2,106 | 1,846 | 1,892 | 1,789 |
| 2022 | 2,091 | 1,857 | 2,005 | 1,968 | 1,898 | 1,700 | 1,876 | 1,830 | 1,706 | 1,565 | 2,191 | 1,726 |
| 2023 | 1,563 | 1,784 | 1,896 | 1,659 | 1,993 | 2,176 | 1,949 | 2,132 | 2,168 | 1,978 | 1,937 | 2,207 |
| 2024 | 2,043 | |||||||||||
| - = No Data Reported; -- = Not Applicable; NA = Not Available; W = Withheld to avoid disclosure of individual company data. |
| Release Date: 3/29/2024 |
| Next Release Date: 4/30/2024 |