|
Download Data (XLS File) |
|
||||||||
|
||||||||
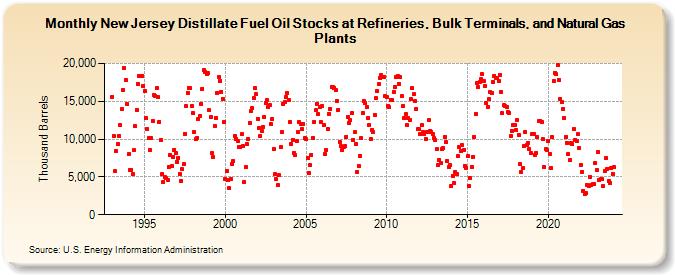
| New Jersey Distillate Fuel Oil Stocks at Refineries, Bulk Terminals, and Natural Gas Plants (Thousand Barrels) | ||||||||
| Year | Jan | Feb | Mar | Apr | May | Jun | Jul | Aug | Sep | Oct | Nov | Dec |
|---|---|---|---|---|---|---|---|---|---|---|---|---|
| 1993 | 15,623 | 10,409 | 5,741 | 8,371 | 9,367 | 10,426 | 11,799 | 13,973 | 16,485 | 19,424 | 17,834 | 14,685 |
| 1994 | 8,011 | 5,894 | 5,962 | 5,333 | 8,506 | 11,711 | 13,896 | 17,305 | 18,394 | 18,296 | 18,409 | 16,997 |
| 1995 | 16,329 | 12,731 | 11,333 | 10,102 | 8,574 | 10,085 | 12,395 | 15,807 | 15,712 | 16,734 | 15,557 | 12,264 |
| 1996 | 9,875 | 5,385 | 4,340 | 4,940 | 4,849 | 4,632 | 6,337 | 7,910 | 6,436 | 7,694 | 8,586 | 8,193 |
| 1997 | 7,017 | 7,537 | 5,366 | 4,513 | 6,011 | 6,694 | 10,739 | 14,320 | 16,141 | 16,755 | 16,729 | 14,385 |
| 1998 | 13,443 | 10,894 | 9,951 | 10,148 | 12,634 | 13,067 | 14,654 | 16,689 | 19,115 | 18,922 | 18,561 | 18,715 |
| 1999 | 13,783 | 12,919 | 8,114 | 7,598 | 11,761 | 12,835 | 16,073 | 18,187 | 17,706 | 16,245 | 15,336 | 12,239 |
| 2000 | 4,723 | 5,776 | 4,560 | 3,482 | 4,784 | 6,748 | 7,084 | 10,437 | 10,067 | 9,717 | 8,911 | 8,962 |
| 2001 | 10,613 | 9,036 | 4,368 | 6,280 | 9,355 | 10,023 | 12,182 | 13,752 | 14,099 | 15,427 | 16,744 | 15,922 |
| 2002 | 12,710 | 11,486 | 10,464 | 11,067 | 11,635 | 12,923 | 14,714 | 15,124 | 14,181 | 14,459 | 12,059 | 12,642 |
| 2003 | 8,683 | 5,322 | 4,686 | 3,868 | 5,186 | 8,950 | 10,904 | 14,677 | 14,850 | 15,611 | 16,080 | 15,126 |
| 2004 | 12,289 | 9,328 | 9,896 | 8,221 | 7,843 | 9,696 | 10,934 | 12,197 | 12,003 | 11,338 | 12,034 | 10,103 |
| 2005 | 9,963 | 7,508 | 5,544 | 6,536 | 7,920 | 10,191 | 12,287 | 13,820 | 14,698 | 13,313 | 14,234 | 12,221 |
| 2006 | 14,406 | 11,863 | 7,995 | 8,586 | 11,315 | 13,352 | 14,007 | 16,902 | 16,841 | 16,795 | 16,523 | 15,032 |
| 2007 | 13,890 | 9,661 | 9,050 | 8,557 | 8,994 | 9,054 | 10,333 | 12,945 | 12,173 | 12,473 | 13,424 | 9,928 |
| 2008 | 10,888 | 9,410 | 5,691 | 6,431 | 7,772 | 10,134 | 13,461 | 14,979 | 14,724 | 14,249 | 12,790 | 11,809 |
| 2009 | 10,076 | 11,232 | 10,876 | 13,237 | 15,383 | 16,307 | 17,227 | 18,117 | 18,520 | 18,274 | 18,275 | 15,654 |
| 2010 | 15,507 | 14,432 | 14,199 | 15,224 | 15,128 | 16,266 | 16,928 | 18,189 | 18,325 | 17,325 | 18,181 | 15,667 |
| 2011 | 14,339 | 12,764 | 13,255 | 11,819 | 12,766 | 12,472 | 15,244 | 16,753 | 15,957 | 14,999 | 14,015 | 11,273 |
| 2012 | 11,290 | 10,636 | 11,807 | 10,942 | 10,648 | 9,968 | 10,954 | 12,476 | 11,104 | 11,002 | 10,670 | 10,122 |
| 2013 | 9,874 | 8,639 | 6,548 | 7,287 | 6,805 | 8,676 | 8,767 | 10,341 | 9,575 | 7,169 | 6,317 | 6,572 |
| 2014 | 3,761 | 5,174 | 4,189 | 5,674 | 5,325 | 7,750 | 8,918 | 8,385 | 9,207 | 8,567 | 6,476 | 6,222 |
| 2015 | 7,733 | 3,804 | 4,867 | 6,345 | 7,676 | 10,318 | 13,286 | 17,424 | 16,854 | 17,576 | 17,909 | 18,591 |
| 2016 | 17,661 | 17,047 | 14,764 | 14,310 | 15,251 | 16,174 | 16,031 | 17,531 | 18,380 | 18,133 | 18,135 | 17,677 |
| 2017 | 18,507 | 16,254 | 13,386 | 14,463 | 14,359 | 14,278 | 13,646 | 13,501 | 10,431 | 11,119 | 11,848 | 11,923 |
| 2018 | 11,212 | 12,501 | 10,605 | 6,697 | 5,675 | 6,144 | 9,087 | 10,968 | 9,248 | 9,521 | 8,674 | 8,157 |
| 2019 | 10,722 | 10,612 | 7,958 | 8,203 | 10,278 | 12,332 | 12,423 | 12,300 | 9,950 | 6,291 | 8,637 | 8,524 |
| 2020 | 9,799 | 8,065 | 6,194 | 10,212 | 17,687 | 18,778 | 18,557 | 19,777 | 17,820 | 15,314 | 14,911 | 14,017 |
| 2021 | 12,814 | 10,336 | 9,531 | 8,002 | 7,230 | 9,478 | 9,348 | 11,317 | 9,934 | 9,762 | 10,624 | 8,843 |
| 2022 | 6,586 | 5,703 | 3,186 | 2,676 | 2,821 | 3,920 | 3,849 | 5,033 | 3,865 | 3,999 | 4,102 | 6,863 |
| 2023 | 5,857 | 8,358 | 4,604 | 4,755 | 4,697 | 3,748 | 5,794 | 7,471 | 6,088 | 4,476 | 4,189 | 6,240 |
| 2024 | 5,436 | |||||||||||
| - = No Data Reported; -- = Not Applicable; NA = Not Available; W = Withheld to avoid disclosure of individual company data. |
| Release Date: 3/29/2024 |
| Next Release Date: 4/30/2024 |