|
Download Data (XLS File) |
|
||||||||
|
||||||||
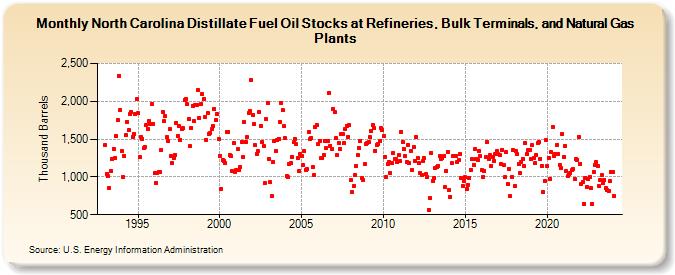
| North Carolina Distillate Fuel Oil Stocks at Refineries, Bulk Terminals, and Natural Gas Plants (Thousand Barrels) | ||||||||
| Year | Jan | Feb | Mar | Apr | May | Jun | Jul | Aug | Sep | Oct | Nov | Dec |
|---|---|---|---|---|---|---|---|---|---|---|---|---|
| 1993 | 1,421 | 1,041 | 1,007 | 856 | 1,076 | 1,240 | 1,371 | 1,255 | 1,539 | 1,753 | 2,341 | 1,888 |
| 1994 | 1,342 | 1,001 | 1,273 | 1,551 | 1,729 | 1,614 | 1,830 | 1,864 | 1,529 | 1,570 | 1,826 | 2,032 |
| 1995 | 1,839 | 1,263 | 1,529 | 1,503 | 1,376 | 1,402 | 1,691 | 1,639 | 1,739 | 1,697 | 1,962 | 1,706 |
| 1996 | 1,051 | 925 | 1,046 | 1,062 | 1,062 | 1,354 | 1,860 | 1,736 | 1,802 | 1,524 | 1,474 | 1,631 |
| 1997 | 1,281 | 1,185 | 1,249 | 1,291 | 1,718 | 1,545 | 1,679 | 1,494 | 1,639 | 1,641 | 2,017 | 2,027 |
| 1998 | 1,963 | 1,767 | 1,407 | 1,651 | 1,943 | 1,738 | 1,949 | 1,957 | 2,147 | 1,785 | 1,961 | 2,095 |
| 1999 | 2,027 | 1,797 | 1,492 | 1,841 | 1,571 | 1,586 | 1,627 | 1,673 | 1,900 | 1,746 | 1,833 | 1,496 |
| 2000 | 1,282 | 843 | 1,224 | 1,205 | 1,183 | 1,598 | 1,596 | 1,292 | 1,272 | 1,075 | 1,446 | 1,061 |
| 2001 | 1,087 | 1,366 | 1,092 | 1,126 | 1,465 | 1,263 | 1,723 | 1,461 | 1,525 | 1,849 | 1,871 | 2,280 |
| 2002 | 1,821 | 1,697 | 1,416 | 1,309 | 1,338 | 1,859 | 1,670 | 1,461 | 1,406 | 918 | 1,764 | 1,981 |
| 2003 | 1,241 | 929 | 745 | 1,194 | 1,476 | 1,341 | 1,493 | 1,505 | 1,728 | 1,972 | 1,883 | 1,667 |
| 2004 | 1,510 | 1,013 | 998 | 1,176 | 1,179 | 1,269 | 1,458 | 1,502 | 1,429 | 1,250 | 1,078 | 1,298 |
| 2005 | 1,278 | 1,151 | 1,339 | 1,095 | 1,098 | 1,596 | 1,496 | 1,517 | 1,130 | 1,019 | 1,666 | 1,688 |
| 2006 | 1,433 | 1,475 | 1,246 | 1,251 | 1,290 | 1,477 | 1,378 | 1,472 | 2,112 | 1,414 | 1,366 | 1,904 |
| 2007 | 1,854 | 1,508 | 1,285 | 1,449 | 1,371 | 1,570 | 1,572 | 1,450 | 1,633 | 1,678 | 1,534 | 1,684 |
| 2008 | 965 | 799 | 878 | 1,020 | 1,144 | 1,285 | 1,386 | 1,480 | 986 | 960 | 1,165 | 1,436 |
| 2009 | 1,445 | 1,463 | 1,523 | 1,601 | 1,685 | 1,650 | 1,346 | 1,427 | 1,434 | 1,471 | 1,653 | 1,617 |
| 2010 | 1,536 | 1,269 | 1,002 | 1,165 | 1,200 | 1,049 | 1,189 | 1,321 | 1,232 | 1,241 | 1,202 | 1,287 |
| 2011 | 1,210 | 1,596 | 1,463 | 1,366 | 1,274 | 1,202 | 1,421 | 1,180 | 1,348 | 1,093 | 1,394 | 1,215 |
| 2012 | 1,528 | 1,253 | 1,179 | 1,048 | 1,024 | 1,205 | 1,246 | 1,032 | 999 | 568 | 722 | 1,320 |
| 2013 | 949 | 992 | 1,120 | 1,126 | 1,149 | 1,276 | 1,238 | 1,245 | 1,277 | 861 | 1,084 | 1,333 |
| 2014 | 828 | 738 | 1,179 | 1,272 | 1,273 | 1,283 | 1,192 | 1,217 | 1,303 | 981 | 880 | 951 |
| 2015 | 993 | 838 | 897 | 992 | 1,096 | 1,232 | 1,161 | 1,367 | 1,242 | 1,221 | 1,343 | 1,275 |
| 2016 | 1,090 | 999 | 1,079 | 1,260 | 1,463 | 1,235 | 1,288 | 1,150 | 1,264 | 1,211 | 1,297 | 1,345 |
| 2017 | 1,302 | 1,295 | 1,168 | 1,362 | 1,151 | 998 | 1,324 | 906 | 1,111 | 742 | 1,001 | 1,359 |
| 2018 | 878 | 1,345 | 1,306 | 1,169 | 1,049 | 1,199 | 1,242 | 1,144 | 1,448 | 1,302 | 1,356 | 1,352 |
| 2019 | 1,237 | 1,421 | 1,247 | 1,183 | 1,295 | 1,448 | 1,466 | 1,243 | 1,150 | 801 | 946 | 1,489 |
| 2020 | 1,146 | 1,253 | 975 | 1,324 | 1,664 | 1,282 | 1,299 | 1,424 | 1,306 | 1,156 | 1,115 | 1,569 |
| 2021 | 1,267 | 1,412 | 1,072 | 1,014 | 1,040 | 1,049 | 1,087 | 1,100 | 969 | 1,234 | 1,227 | 1,532 |
| 2022 | 1,174 | 911 | 932 | 648 | 987 | 873 | 969 | 1,002 | 848 | 647 | 1,070 | 1,160 |
| 2023 | 1,195 | 1,145 | 876 | 959 | 1,019 | 918 | 956 | 851 | 825 | 814 | 941 | 1,071 |
| 2024 | 1,063 | |||||||||||
| - = No Data Reported; -- = Not Applicable; NA = Not Available; W = Withheld to avoid disclosure of individual company data. |
| Release Date: 3/29/2024 |
| Next Release Date: 4/30/2024 |