|
Download Data (XLS File) |
|
||||||||
|
||||||||
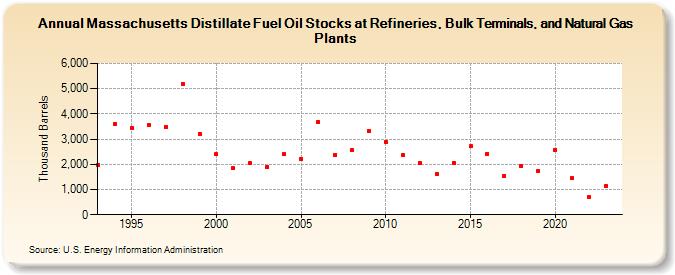
| Massachusetts Distillate Fuel Oil Stocks at Refineries, Bulk Terminals, and Natural Gas Plants (Thousand Barrels) | ||||||||
| Decade | Year-0 | Year-1 | Year-2 | Year-3 | Year-4 | Year-5 | Year-6 | Year-7 | Year-8 | Year-9 |
|---|---|---|---|---|---|---|---|---|---|---|
| 1990's | 1,964 | 3,612 | 3,448 | 3,566 | 3,494 | 5,195 | 3,221 | |||
| 2000's | 2,401 | 1,838 | 2,038 | 1,897 | 2,398 | 2,229 | 3,696 | 2,386 | 2,550 | 3,330 |
| 2010's | 2,901 | 2,371 | 2,055 | 1,602 | 2,070 | 2,716 | 2,421 | 1,536 | 1,929 | 1,745 |
| 2020's | 2,579 | 1,444 | 692 | 1,157 |
| - = No Data Reported; -- = Not Applicable; NA = Not Available; W = Withheld to avoid disclosure of individual company data. |
| Release Date: 4/30/2024 |
| Next Release Date: 8/30/2024 |