|
Download Data (XLS File) |
|
||||||||
|
||||||||
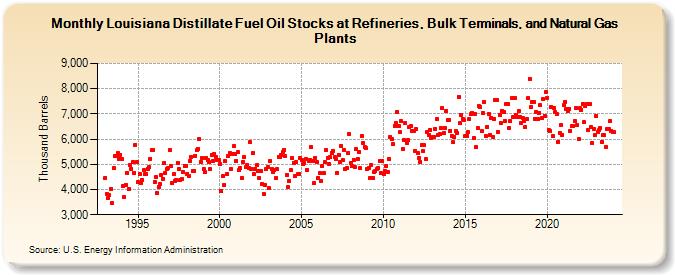
| Louisiana Distillate Fuel Oil Stocks at Refineries, Bulk Terminals, and Natural Gas Plants (Thousand Barrels) | ||||||||
| Year | Jan | Feb | Mar | Apr | May | Jun | Jul | Aug | Sep | Oct | Nov | Dec |
|---|---|---|---|---|---|---|---|---|---|---|---|---|
| 1993 | 4,463 | 3,814 | 3,655 | 3,765 | 4,022 | 3,454 | 4,855 | 5,348 | 5,316 | 5,440 | 5,208 | 5,384 |
| 1994 | 5,225 | 4,124 | 3,704 | 4,193 | 4,668 | 4,018 | 4,962 | 4,828 | 5,086 | 4,673 | 5,783 | 5,097 |
| 1995 | 4,292 | 4,627 | 4,278 | 4,390 | 4,761 | 4,599 | 4,624 | 4,817 | 4,874 | 5,227 | 5,548 | 5,583 |
| 1996 | 4,299 | 4,495 | 3,842 | 4,097 | 4,223 | 4,581 | 4,435 | 5,043 | 4,659 | 4,806 | 4,859 | 5,563 |
| 1997 | 4,929 | 4,243 | 4,600 | 4,349 | 4,376 | 5,055 | 4,815 | 4,368 | 4,400 | 4,709 | 4,949 | 4,948 |
| 1998 | 4,619 | 4,543 | 5,140 | 5,287 | 4,736 | 4,751 | 5,348 | 5,550 | 5,615 | 6,003 | 5,110 | 5,268 |
| 1999 | 4,820 | 4,691 | 5,252 | 5,162 | 5,081 | 4,809 | 5,376 | 5,135 | 5,410 | 5,308 | 5,173 | 5,159 |
| 2000 | 5,004 | 3,929 | 4,520 | 4,164 | 5,118 | 4,601 | 5,312 | 5,454 | 4,795 | 5,423 | 5,714 | 5,396 |
| 2001 | 5,122 | 5,474 | 4,759 | 4,860 | 4,469 | 5,100 | 5,273 | 4,876 | 4,966 | 4,853 | 5,867 | 4,824 |
| 2002 | 5,455 | 4,600 | 4,824 | 4,965 | 4,750 | 4,449 | 4,723 | 4,213 | 3,830 | 4,192 | 4,817 | 4,874 |
| 2003 | 4,041 | 5,139 | 4,801 | 4,675 | 4,763 | 4,439 | 4,818 | 5,299 | 5,299 | 5,360 | 5,484 | 5,584 |
| 2004 | 5,321 | 4,588 | 4,090 | 4,338 | 4,757 | 5,260 | 5,065 | 4,531 | 5,082 | 4,603 | 4,627 | 5,246 |
| 2005 | 5,168 | 5,000 | 5,063 | 5,218 | 4,771 | 5,138 | 5,182 | 5,670 | 5,122 | 4,239 | 5,265 | 5,091 |
| 2006 | 4,464 | 4,648 | 4,322 | 4,934 | 4,646 | 5,090 | 5,565 | 5,264 | 5,027 | 5,274 | 5,464 | 5,529 |
| 2007 | 5,298 | 5,197 | 4,667 | 5,361 | 5,083 | 5,736 | 5,167 | 5,567 | 4,823 | 4,843 | 5,455 | 6,186 |
| 2008 | 5,062 | 4,933 | 5,186 | 4,880 | 5,589 | 5,222 | 5,487 | 4,838 | 6,125 | 5,854 | 5,701 | 5,646 |
| 2009 | 4,819 | 4,839 | 4,437 | 4,965 | 4,452 | 4,689 | 4,715 | 4,797 | 4,863 | 5,137 | 4,655 | 5,145 |
| 2010 | 4,612 | 4,731 | 4,938 | 4,679 | 5,203 | 6,093 | 6,020 | 5,802 | 6,531 | 6,627 | 7,086 | 6,512 |
| 2011 | 6,266 | 6,708 | 5,608 | 5,949 | 6,657 | 5,836 | 5,957 | 6,481 | 6,508 | 6,336 | 6,337 | 5,539 |
| 2012 | 6,398 | 5,434 | 5,252 | 5,086 | 5,779 | 5,521 | 5,750 | 5,199 | 6,298 | 6,167 | 6,375 | 6,041 |
| 2013 | 6,095 | 6,100 | 6,404 | 6,806 | 6,169 | 6,220 | 6,452 | 7,218 | 6,246 | 6,457 | 7,114 | 6,754 |
| 2014 | 6,762 | 6,331 | 6,136 | 5,866 | 6,093 | 6,310 | 6,257 | 7,680 | 6,622 | 6,950 | 6,812 | 6,747 |
| 2015 | 6,142 | 6,135 | 6,269 | 6,788 | 6,980 | 7,031 | 6,046 | 7,014 | 5,686 | 6,444 | 7,311 | 7,262 |
| 2016 | 6,304 | 7,034 | 7,465 | 6,104 | 6,491 | 7,000 | 6,163 | 6,851 | 6,103 | 6,813 | 7,532 | 7,535 |
| 2017 | 6,296 | 6,972 | 6,628 | 7,127 | 7,079 | 6,721 | 7,388 | 7,373 | 6,453 | 6,710 | 7,616 | 6,879 |
| 2018 | 7,635 | 6,975 | 6,895 | 7,114 | 6,876 | 6,647 | 6,843 | 6,733 | 6,472 | 6,779 | 7,626 | 8,396 |
| 2019 | 7,287 | 7,465 | 7,483 | 6,808 | 7,088 | 6,797 | 7,055 | 7,341 | 6,835 | 7,578 | 6,930 | 7,880 |
| 2020 | 7,648 | 6,351 | 6,326 | 7,279 | 6,130 | 7,239 | 7,082 | 7,000 | 5,901 | 6,243 | 6,542 | 6,176 |
| 2021 | 7,337 | 7,489 | 7,208 | 7,097 | 7,211 | 6,332 | 6,505 | 6,521 | 6,699 | 7,233 | 6,557 | 5,985 |
| 2022 | 7,222 | 7,160 | 7,394 | 6,659 | 7,294 | 7,383 | 6,362 | 7,390 | 6,472 | 5,836 | 6,418 | 6,170 |
| 2023 | 6,915 | 6,270 | 6,349 | 6,427 | 5,901 | 6,163 | 6,143 | 5,697 | 6,397 | 6,396 | 6,717 | 6,329 |
| 2024 | 6,295 | |||||||||||
| - = No Data Reported; -- = Not Applicable; NA = Not Available; W = Withheld to avoid disclosure of individual company data. |
| Release Date: 3/29/2024 |
| Next Release Date: 4/30/2024 |