|
Download Data (XLS File) |
|
||||||||
|
||||||||
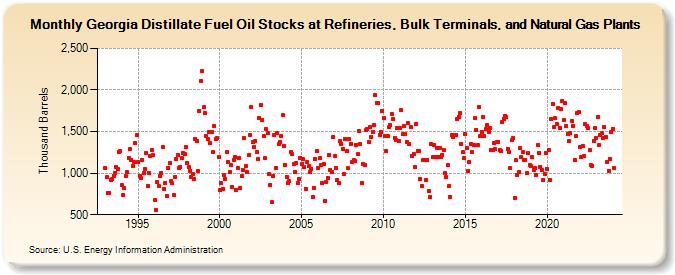
| Georgia Distillate Fuel Oil Stocks at Refineries, Bulk Terminals, and Natural Gas Plants (Thousand Barrels) | ||||||||
| Year | Jan | Feb | Mar | Apr | May | Jun | Jul | Aug | Sep | Oct | Nov | Dec |
|---|---|---|---|---|---|---|---|---|---|---|---|---|
| 1993 | 1,059 | 950 | 765 | 763 | 919 | 925 | 967 | 1,006 | 1,069 | 1,051 | 1,258 | 1,265 |
| 1994 | 854 | 741 | 818 | 965 | 1,015 | 1,179 | 1,289 | 1,162 | 1,087 | 1,133 | 1,359 | 1,455 |
| 1995 | 1,128 | 969 | 947 | 1,162 | 1,005 | 1,047 | 1,246 | 851 | 1,006 | 1,211 | 1,278 | 1,218 |
| 1996 | 674 | 551 | 889 | 846 | 961 | 1,002 | 1,316 | 813 | 887 | 726 | 1,060 | 1,125 |
| 1997 | 900 | 876 | 733 | 949 | 1,166 | 1,216 | 1,059 | 1,077 | 1,178 | 1,248 | 1,227 | 1,312 |
| 1998 | 1,125 | 1,068 | 1,026 | 951 | 987 | 924 | 1,412 | 1,390 | 1,021 | 1,750 | 2,110 | 2,226 |
| 1999 | 1,792 | 1,724 | 1,444 | 1,409 | 1,491 | 1,360 | 1,489 | 1,250 | 1,561 | 1,405 | 1,418 | 1,194 |
| 2000 | 795 | 879 | 811 | 972 | 931 | 1,250 | 1,136 | 1,013 | 1,094 | 839 | 1,159 | 1,197 |
| 2001 | 802 | 1,062 | 1,183 | 819 | 963 | 1,037 | 1,425 | 1,080 | 1,011 | 1,213 | 1,464 | 1,796 |
| 2002 | 1,371 | 1,315 | 1,386 | 1,249 | 1,172 | 1,664 | 1,824 | 1,644 | 1,447 | 1,177 | 1,527 | 1,485 |
| 2003 | 988 | 858 | 649 | 971 | 1,460 | 1,063 | 1,487 | 1,349 | 1,375 | 1,441 | 1,695 | 1,324 |
| 2004 | 1,092 | 957 | 879 | 901 | 1,256 | 1,225 | 1,104 | 1,012 | 1,126 | 880 | 934 | 1,187 |
| 2005 | 1,113 | 1,165 | 1,076 | 815 | 1,130 | 1,081 | 1,016 | 1,054 | 709 | 826 | 1,174 | 1,271 |
| 2006 | 1,065 | 1,177 | 1,100 | 877 | 1,110 | 667 | 896 | 947 | 1,217 | 1,043 | 1,009 | 1,430 |
| 2007 | 1,211 | 1,058 | 922 | 884 | 1,384 | 1,356 | 1,290 | 991 | 1,413 | 1,264 | 1,057 | 1,407 |
| 2008 | 1,356 | 1,136 | 1,155 | 1,150 | 1,342 | 1,230 | 1,511 | 1,345 | 882 | 1,106 | 1,101 | 1,515 |
| 2009 | 1,536 | 1,374 | 1,556 | 1,440 | 1,494 | 1,576 | 1,939 | 1,844 | 1,839 | 1,457 | 1,497 | 1,745 |
| 2010 | 1,657 | 1,444 | 1,263 | 1,445 | 1,551 | 1,573 | 1,713 | 1,645 | 1,423 | 1,399 | 1,539 | 1,386 |
| 2011 | 1,544 | 1,756 | 1,467 | 1,570 | 1,469 | 1,374 | 1,597 | 1,350 | 1,558 | 1,205 | 1,229 | 1,078 |
| 2012 | 1,590 | 1,270 | 1,271 | 930 | 845 | 1,152 | 1,163 | 919 | 1,155 | 788 | 712 | 1,349 |
| 2013 | 1,189 | 1,341 | 1,200 | 1,304 | 1,195 | 1,302 | 1,193 | 1,217 | 1,277 | 1,003 | 950 | 1,101 |
| 2014 | 848 | 714 | 1,459 | 1,438 | 1,455 | 1,460 | 1,649 | 1,673 | 1,726 | 1,355 | 1,251 | 1,178 |
| 2015 | 1,468 | 1,307 | 1,020 | 1,129 | 1,354 | 1,249 | 1,340 | 1,658 | 1,523 | 1,334 | 1,794 | 1,451 |
| 2016 | 1,498 | 1,677 | 1,441 | 1,529 | 1,580 | 1,490 | 1,540 | 1,280 | 1,276 | 1,363 | 1,285 | 1,372 |
| 2017 | 1,375 | 1,282 | 1,261 | 1,615 | 1,651 | 1,690 | 1,671 | 1,296 | 1,254 | 1,060 | 1,395 | 1,428 |
| 2018 | 705 | 1,153 | 973 | 1,012 | 1,300 | 1,194 | 1,251 | 1,156 | 1,158 | 1,001 | 1,243 | 1,097 |
| 2019 | 1,081 | 1,190 | 1,036 | 1,056 | 982 | 1,339 | 1,245 | 1,078 | 1,032 | 913 | 988 | 1,248 |
| 2020 | 1,052 | 1,281 | 922 | 1,650 | 1,836 | 1,554 | 1,658 | 1,592 | 1,786 | 1,548 | 1,768 | 1,868 |
| 2021 | 1,637 | 1,838 | 1,565 | 1,468 | 1,388 | 1,483 | 1,629 | 1,565 | 1,159 | 1,441 | 1,722 | 1,737 |
| 2022 | 1,317 | 1,195 | 1,323 | 1,211 | 1,586 | 1,568 | 1,541 | 1,277 | 1,099 | 1,087 | 1,386 | 1,539 |
| 2023 | 1,425 | 1,678 | 1,339 | 1,460 | 1,477 | 1,420 | 1,556 | 1,435 | 1,134 | 1,029 | 1,175 | 1,500 |
| 2024 | 1,534 | |||||||||||
| - = No Data Reported; -- = Not Applicable; NA = Not Available; W = Withheld to avoid disclosure of individual company data. |
| Release Date: 3/29/2024 |
| Next Release Date: 4/30/2024 |