|
Download Data (XLS File) |
|
||||||||
|
||||||||
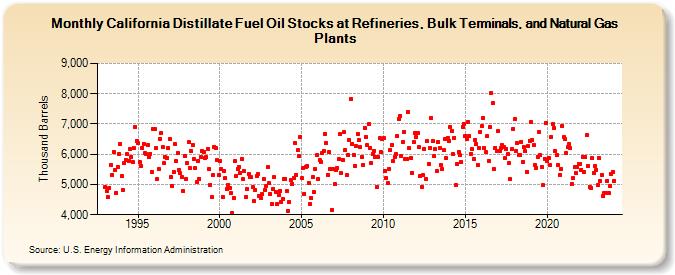
| California Distillate Fuel Oil Stocks at Refineries, Bulk Terminals, and Natural Gas Plants (Thousand Barrels) | ||||||||
| Year | Jan | Feb | Mar | Apr | May | Jun | Jul | Aug | Sep | Oct | Nov | Dec |
|---|---|---|---|---|---|---|---|---|---|---|---|---|
| 1993 | 4,918 | 4,770 | 4,588 | 4,892 | 5,643 | 5,298 | 6,081 | 5,488 | 4,731 | 5,590 | 6,001 | 6,337 |
| 1994 | 5,280 | 4,811 | 5,715 | 5,821 | 6,006 | 5,777 | 6,189 | 5,900 | 5,735 | 6,192 | 6,909 | 6,446 |
| 1995 | 6,377 | 5,749 | 5,601 | 6,219 | 6,352 | 6,025 | 6,004 | 6,308 | 5,896 | 6,019 | 5,423 | 6,849 |
| 1996 | 6,839 | 6,217 | 5,183 | 5,508 | 6,517 | 6,695 | 6,237 | 5,696 | 5,904 | 5,867 | 6,204 | 6,494 |
| 1997 | 5,249 | 4,955 | 5,423 | 6,337 | 5,765 | 6,038 | 5,489 | 5,368 | 5,240 | 4,776 | 5,927 | 5,186 |
| 1998 | 5,706 | 6,403 | 5,538 | 6,102 | 6,319 | 5,848 | 5,529 | 5,080 | 5,791 | 5,187 | 5,900 | 6,110 |
| 1999 | 6,087 | 5,861 | 5,914 | 6,189 | 5,504 | 4,991 | 4,573 | 5,319 | 6,245 | 6,207 | 5,804 | 5,308 |
| 2000 | 5,776 | 5,511 | 4,602 | 5,439 | 5,210 | 4,848 | 4,995 | 4,887 | 4,716 | 4,058 | 4,559 | 5,762 |
| 2001 | 5,293 | 5,501 | 5,586 | 5,385 | 5,842 | 5,176 | 5,438 | 4,584 | 4,846 | 5,354 | 5,253 | 5,235 |
| 2002 | 4,911 | 4,439 | 4,823 | 5,282 | 5,351 | 4,615 | 4,544 | 4,689 | 5,196 | 4,824 | 4,950 | 5,568 |
| 2003 | 5,040 | 4,692 | 4,351 | 4,848 | 5,232 | 4,739 | 4,351 | 4,666 | 4,796 | 4,414 | 4,522 | 5,177 |
| 2004 | 5,193 | 4,770 | 4,128 | 4,420 | 5,132 | 5,008 | 5,214 | 6,376 | 5,305 | 6,126 | 5,933 | 6,573 |
| 2005 | 5,200 | 5,548 | 4,697 | 5,594 | 5,618 | 5,056 | 4,349 | 4,555 | 5,245 | 4,754 | 5,508 | 5,960 |
| 2006 | 5,168 | 5,800 | 5,742 | 6,024 | 6,110 | 6,667 | 6,363 | 5,323 | 6,068 | 5,496 | 4,167 | 5,497 |
| 2007 | 5,012 | 5,494 | 5,552 | 5,837 | 6,659 | 5,378 | 5,813 | 6,722 | 6,138 | 5,303 | 5,975 | 6,472 |
| 2008 | 7,819 | 6,349 | 5,987 | 5,609 | 6,267 | 6,675 | 6,467 | 6,238 | 5,910 | 5,656 | 6,880 | 6,577 |
| 2009 | 6,300 | 6,989 | 6,206 | 5,711 | 6,006 | 6,118 | 5,918 | 4,926 | 5,906 | 6,526 | 6,076 | 6,500 |
| 2010 | 6,529 | 5,445 | 5,199 | 5,046 | 5,504 | 6,137 | 6,301 | 5,762 | 5,921 | 5,999 | 6,590 | 7,163 |
| 2011 | 7,273 | 5,954 | 6,389 | 6,750 | 5,851 | 5,834 | 7,394 | 6,191 | 5,891 | 5,390 | 6,396 | 6,707 |
| 2012 | 6,563 | 6,718 | 6,225 | 5,286 | 4,928 | 5,307 | 6,186 | 5,188 | 6,441 | 5,682 | 6,215 | 7,210 |
| 2013 | 6,432 | 5,925 | 6,163 | 5,460 | 6,397 | 6,199 | 5,632 | 5,505 | 6,146 | 6,488 | 5,883 | 6,551 |
| 2014 | 6,442 | 6,916 | 6,776 | 5,999 | 6,551 | 4,971 | 5,673 | 6,086 | 5,958 | 5,736 | 6,909 | 7,005 |
| 2015 | 6,613 | 6,501 | 7,074 | 6,601 | 6,020 | 6,163 | 5,846 | 6,463 | 6,330 | 5,650 | 6,209 | 6,742 |
| 2016 | 6,926 | 7,205 | 6,202 | 6,071 | 6,609 | 5,781 | 6,914 | 8,008 | 7,677 | 5,497 | 6,213 | 6,119 |
| 2017 | 6,754 | 6,105 | 6,203 | 6,297 | 6,238 | 5,873 | 6,184 | 5,994 | 5,723 | 5,179 | 6,159 | 6,849 |
| 2018 | 7,153 | 6,102 | 6,360 | 5,977 | 5,966 | 6,412 | 5,746 | 6,224 | 6,099 | 5,427 | 6,257 | 6,448 |
| 2019 | 7,050 | 6,468 | 6,298 | 5,649 | 5,560 | 5,920 | 6,741 | 5,975 | 5,583 | 4,969 | 5,857 | 7,040 |
| 2020 | 5,776 | 5,878 | 5,636 | 6,576 | 7,000 | 6,854 | 6,099 | 5,960 | 5,650 | 5,323 | 5,523 | 6,942 |
| 2021 | 6,577 | 6,490 | 6,030 | 6,250 | 6,327 | 6,191 | 5,011 | 5,198 | 5,570 | 5,365 | 5,589 | 5,674 |
| 2022 | 5,669 | 5,489 | 5,912 | 5,414 | 5,900 | 6,625 | 5,622 | 4,929 | 4,896 | 5,865 | 5,392 | 5,597 |
| 2023 | 5,482 | 4,980 | 5,869 | 5,099 | 5,316 | 4,608 | 4,705 | 4,704 | 5,128 | 4,704 | 4,943 | 5,358 |
| 2024 | 5,425 | |||||||||||
| - = No Data Reported; -- = Not Applicable; NA = Not Available; W = Withheld to avoid disclosure of individual company data. |
| Release Date: 3/29/2024 |
| Next Release Date: 4/30/2024 |