|
Download Data (XLS File) |
|
||||||||
|
||||||||
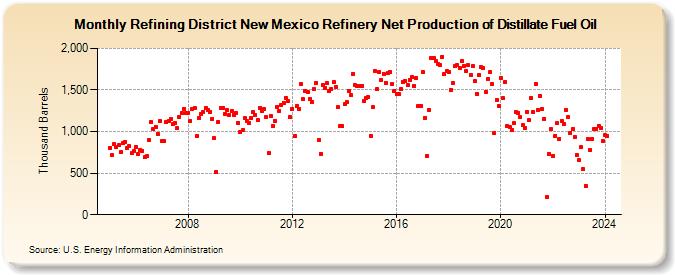
| Refining District New Mexico Refinery Net Production of Distillate Fuel Oil (Thousand Barrels) | ||||||||
| Year | Jan | Feb | Mar | Apr | May | Jun | Jul | Aug | Sep | Oct | Nov | Dec |
|---|---|---|---|---|---|---|---|---|---|---|---|---|
| 2005 | 803 | 714 | 846 | 810 | 836 | 751 | 864 | 878 | 805 | 823 | 741 | 761 |
| 2006 | 817 | 727 | 782 | 772 | 689 | 702 | 903 | 1,113 | 1,025 | 1,055 | 974 | 1,132 |
| 2007 | 891 | 883 | 1,113 | 1,128 | 1,155 | 1,092 | 1,100 | 1,039 | 1,179 | 1,221 | 1,274 | 1,221 |
| 2008 | 1,228 | 1,126 | 1,267 | 1,289 | 941 | 1,163 | 1,211 | 1,240 | 1,281 | 1,264 | 1,237 | 1,154 |
| 2009 | 917 | 515 | 1,117 | 1,282 | 1,284 | 1,216 | 1,258 | 1,198 | 1,250 | 1,204 | 1,223 | 1,108 |
| 2010 | 997 | 1,013 | 1,157 | 1,131 | 1,103 | 1,164 | 1,234 | 1,194 | 1,140 | 1,287 | 1,244 | 1,268 |
| 2011 | 1,172 | 744 | 1,188 | 1,067 | 1,132 | 1,301 | 1,252 | 1,316 | 1,347 | 1,405 | 1,367 | 1,175 |
| 2012 | 1,274 | 942 | 1,309 | 1,277 | 1,568 | 1,388 | 1,487 | 1,471 | 1,395 | 1,357 | 1,509 | 1,588 |
| 2013 | 896 | 736 | 1,560 | 1,527 | 1,583 | 1,492 | 1,509 | 1,592 | 1,536 | 1,294 | 1,065 | 1,062 |
| 2014 | 1,331 | 1,350 | 1,490 | 1,439 | 1,698 | 1,556 | 1,548 | 1,552 | 1,549 | 1,367 | 1,407 | 1,412 |
| 2015 | 951 | 1,290 | 1,731 | 1,506 | 1,719 | 1,614 | 1,696 | 1,587 | 1,704 | 1,719 | 1,573 | 1,485 |
| 2016 | 1,454 | 1,455 | 1,509 | 1,596 | 1,608 | 1,559 | 1,621 | 1,653 | 1,551 | 1,646 | 1,308 | 1,313 |
| 2017 | 1,711 | 1,166 | 711 | 1,262 | 1,881 | 1,884 | 1,847 | 1,817 | 1,798 | 1,901 | 1,690 | 1,731 |
| 2018 | 1,718 | 1,505 | 1,587 | 1,783 | 1,796 | 1,761 | 1,846 | 1,794 | 1,730 | 1,800 | 1,681 | 1,786 |
| 2019 | 1,602 | 1,457 | 1,681 | 1,771 | 1,761 | 1,481 | 1,634 | 1,712 | 1,572 | 978 | 1,378 | 1,307 |
| 2020 | 1,646 | 1,399 | 1,596 | 1,067 | 1,053 | 1,022 | 1,100 | 1,237 | 1,228 | 1,170 | 1,075 | 1,042 |
| 2021 | 1,240 | 1,135 | 1,409 | 1,233 | 1,570 | 1,263 | 1,433 | 1,269 | 1,156 | 210 | 733 | 1,026 |
| 2022 | 703 | 952 | 1,099 | 914 | 1,128 | 1,086 | 1,265 | 1,170 | 986 | 1,027 | 936 | 722 |
| 2023 | 652 | 814 | 548 | 349 | 910 | 781 | 910 | 1,029 | 1,033 | 1,071 | 1,043 | 884 |
| 2024 | 953 | 947 | ||||||||||
| - = No Data Reported; -- = Not Applicable; NA = Not Available; W = Withheld to avoid disclosure of individual company data. |
| Release Date: 4/30/2024 |
| Next Release Date: 5/31/2024 |