|
Download Data (XLS File) |
|
||||||||
|
||||||||
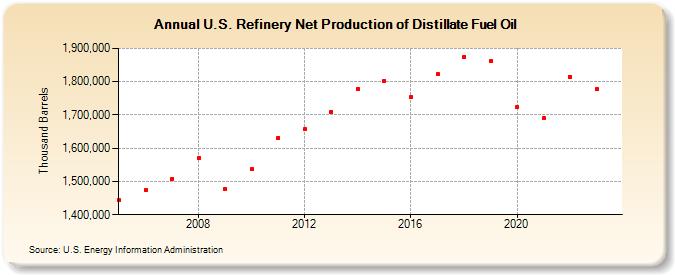
| U.S. Refinery Net Production of Distillate Fuel Oil (Thousand Barrels) | ||||||||
| Decade | Year-0 | Year-1 | Year-2 | Year-3 | Year-4 | Year-5 | Year-6 | Year-7 | Year-8 | Year-9 |
|---|---|---|---|---|---|---|---|---|---|---|
| 2000's | 1,443,348 | 1,474,741 | 1,508,530 | 1,571,539 | 1,476,418 | |||||
| 2010's | 1,537,950 | 1,631,692 | 1,656,471 | 1,710,221 | 1,778,319 | 1,802,398 | 1,753,718 | 1,821,808 | 1,875,350 | 1,862,069 |
| 2020's | 1,722,457 | 1,690,730 | 1,815,402 | 1,777,110 |
| - = No Data Reported; -- = Not Applicable; NA = Not Available; W = Withheld to avoid disclosure of individual company data. |
| Release Date: 4/30/2024 |
| Next Release Date: 8/30/2024 |