|
Download Data (XLS File) |
|
||||||||
|
||||||||
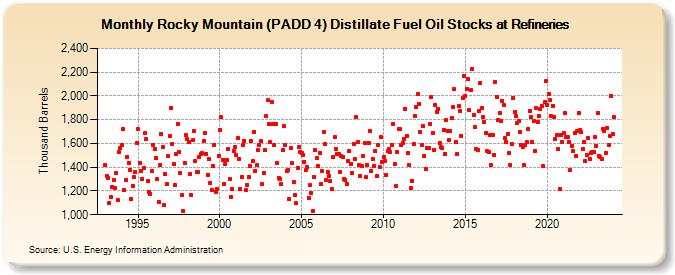
| Rocky Mountain (PADD 4) Distillate Fuel Oil Stocks at Refineries (Thousand Barrels) | ||||||||
| Year | Jan | Feb | Mar | Apr | May | Jun | Jul | Aug | Sep | Oct | Nov | Dec |
|---|---|---|---|---|---|---|---|---|---|---|---|---|
| 1993 | 1,417 | 1,327 | 1,312 | 1,098 | 1,145 | 1,232 | 1,288 | 1,221 | 1,353 | 1,121 | 1,528 | 1,559 |
| 1994 | 1,587 | 1,723 | 1,208 | 1,292 | 1,488 | 1,438 | 1,378 | 1,136 | 1,240 | 1,318 | 1,359 | 1,604 |
| 1995 | 1,719 | 1,432 | 1,372 | 1,304 | 1,390 | 1,687 | 1,635 | 1,283 | 1,195 | 1,177 | 1,370 | 1,584 |
| 1996 | 1,549 | 1,480 | 1,299 | 1,109 | 1,418 | 1,683 | 1,569 | 1,082 | 1,345 | 1,255 | 1,491 | 1,661 |
| 1997 | 1,899 | 1,594 | 1,430 | 1,250 | 1,511 | 1,764 | 1,529 | 1,348 | 1,168 | 1,033 | 1,436 | 1,668 |
| 1998 | 1,640 | 1,608 | 1,346 | 1,164 | 1,626 | 1,707 | 1,456 | 1,358 | 1,356 | 1,482 | 1,507 | 1,519 |
| 1999 | 1,618 | 1,687 | 1,512 | 1,335 | 1,472 | 1,267 | 1,211 | 1,406 | 1,590 | 1,194 | 1,216 | 1,495 |
| 2000 | 1,716 | 1,819 | 1,463 | 1,261 | 1,423 | 1,463 | 1,551 | 1,299 | 1,150 | 1,219 | 1,535 | 1,572 |
| 2001 | 1,504 | 1,644 | 1,473 | 1,217 | 1,318 | 1,591 | 1,623 | 1,209 | 1,253 | 1,319 | 1,414 | 1,617 |
| 2002 | 1,452 | 1,697 | 1,371 | 1,418 | 1,544 | 1,586 | 1,618 | 1,255 | 1,353 | 1,541 | 1,828 | 1,963 |
| 2003 | 1,761 | 1,608 | 1,952 | 1,762 | 1,590 | 1,763 | 1,435 | 1,312 | 1,299 | 1,259 | 1,546 | 1,747 |
| 2004 | 1,587 | 1,366 | 1,376 | 1,132 | 1,565 | 1,432 | 1,276 | 1,167 | 1,097 | 1,397 | 1,570 | 1,528 |
| 2005 | 1,518 | 1,501 | 1,446 | 1,375 | 1,401 | 1,144 | 1,250 | 1,183 | 1,033 | 1,317 | 1,542 | 1,478 |
| 2006 | 1,412 | 1,522 | 1,255 | 1,368 | 1,699 | 1,593 | 1,295 | 1,363 | 1,324 | 1,280 | 1,220 | 1,486 |
| 2007 | 1,654 | 1,556 | 1,510 | 1,514 | 1,363 | 1,496 | 1,488 | 1,303 | 1,292 | 1,260 | 1,451 | 1,540 |
| 2008 | 1,429 | 1,353 | 1,594 | 1,470 | 1,819 | 1,613 | 1,422 | 1,326 | 1,412 | 1,491 | 1,602 | 1,315 |
| 2009 | 1,421 | 1,606 | 1,703 | 1,367 | 1,473 | 1,406 | 1,535 | 1,323 | 1,587 | 1,401 | 1,654 | 1,443 |
| 2010 | 1,487 | 1,456 | 1,338 | 1,535 | 1,549 | 1,529 | 1,589 | 1,766 | 1,430 | 1,238 | 1,528 | 1,721 |
| 2011 | 1,719 | 1,583 | 1,602 | 1,640 | 1,893 | 1,665 | 1,518 | 1,418 | 1,224 | 1,286 | 1,598 | 1,834 |
| 2012 | 1,908 | 2,016 | 1,935 | 1,699 | 1,591 | 1,750 | 1,497 | 1,389 | 1,559 | 1,561 | 1,763 | 1,993 |
| 2013 | 1,689 | 1,545 | 1,927 | 1,865 | 1,891 | 1,601 | 1,568 | 1,563 | 1,714 | 1,508 | 1,798 | 1,706 |
| 2014 | 1,627 | 1,706 | 1,817 | 1,905 | 2,058 | 1,616 | 1,510 | 1,914 | 1,875 | 1,664 | 1,980 | 2,167 |
| 2015 | 2,003 | 2,058 | 2,146 | 1,878 | 2,046 | 2,223 | 1,843 | 1,735 | 1,554 | 1,541 | 1,871 | 2,105 |
| 2016 | 1,898 | 1,823 | 1,780 | 1,687 | 1,535 | 1,525 | 1,667 | 1,416 | 1,669 | 1,505 | 2,121 | 1,987 |
| 2017 | 1,798 | 1,860 | 1,786 | 1,961 | 1,922 | 1,643 | 1,612 | 1,679 | 1,523 | 1,420 | 1,596 | 1,983 |
| 2018 | 1,861 | 1,827 | 1,774 | 1,793 | 1,697 | 1,586 | 1,566 | 1,415 | 1,590 | 1,608 | 1,723 | 1,873 |
| 2019 | 1,824 | 1,611 | 1,785 | 1,539 | 1,901 | 1,781 | 1,830 | 1,887 | 1,916 | 1,406 | 1,946 | 2,124 |
| 2020 | 1,921 | 2,020 | 1,963 | 1,832 | 1,917 | 1,826 | 1,637 | 1,667 | 1,550 | 1,215 | 1,671 | 1,609 |
| 2021 | 1,684 | 1,852 | 1,653 | 1,653 | 1,612 | 1,373 | 1,581 | 1,534 | 1,690 | 1,497 | 1,708 | 1,859 |
| 2022 | 1,712 | 1,694 | 1,550 | 1,612 | 1,450 | 1,504 | 1,646 | 1,472 | 1,516 | 1,532 | 1,525 | 1,650 |
| 2023 | 1,580 | 1,859 | 1,498 | 1,483 | 1,466 | 1,720 | 1,702 | 1,521 | 1,731 | 1,587 | 1,666 | 2,003 |
| 2024 | 1,682 | |||||||||||
| - = No Data Reported; -- = Not Applicable; NA = Not Available; W = Withheld to avoid disclosure of individual company data. |
| Release Date: 3/29/2024 |
| Next Release Date: 4/30/2024 |