|
Download Data (XLS File) |
|
||||||||
|
||||||||
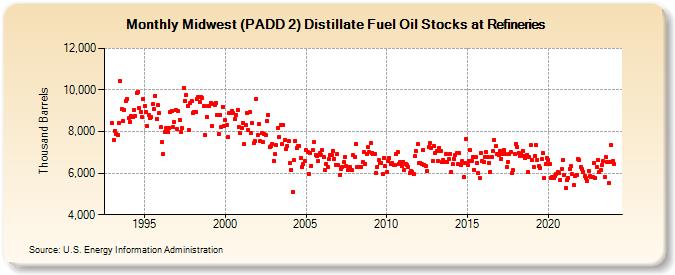
| Midwest (PADD 2) Distillate Fuel Oil Stocks at Refineries (Thousand Barrels) | ||||||||
| Year | Jan | Feb | Mar | Apr | May | Jun | Jul | Aug | Sep | Oct | Nov | Dec |
|---|---|---|---|---|---|---|---|---|---|---|---|---|
| 1993 | 8,388 | 7,606 | 8,039 | 7,859 | 7,812 | 8,434 | 10,419 | 9,096 | 8,510 | 9,050 | 9,479 | 9,556 |
| 1994 | 8,636 | 8,449 | 8,755 | 8,703 | 9,033 | 8,758 | 9,852 | 9,907 | 9,112 | 8,958 | 8,695 | 9,547 |
| 1995 | 9,232 | 8,957 | 8,258 | 8,813 | 8,638 | 8,688 | 9,313 | 9,088 | 9,726 | 8,616 | 9,258 | 8,890 |
| 1996 | 8,206 | 7,493 | 6,928 | 7,992 | 8,150 | 7,985 | 8,149 | 8,924 | 9,009 | 8,228 | 8,466 | 9,056 |
| 1997 | 8,108 | 8,989 | 8,564 | 7,984 | 8,149 | 10,101 | 9,483 | 9,778 | 9,232 | 8,055 | 9,388 | 9,474 |
| 1998 | 8,887 | 8,951 | 8,940 | 9,574 | 9,648 | 9,426 | 9,646 | 9,603 | 9,239 | 7,832 | 8,710 | 9,231 |
| 1999 | 9,251 | 9,387 | 8,261 | 9,335 | 9,272 | 9,376 | 8,777 | 7,889 | 8,798 | 8,236 | 9,200 | 8,255 |
| 2000 | 8,556 | 8,322 | 7,718 | 8,887 | 8,906 | 9,011 | 8,891 | 8,602 | 8,816 | 9,043 | 8,221 | 7,912 |
| 2001 | 8,194 | 8,425 | 7,383 | 8,306 | 8,912 | 8,078 | 8,920 | 7,947 | 8,400 | 7,433 | 7,536 | 9,570 |
| 2002 | 7,830 | 8,362 | 7,535 | 7,926 | 7,484 | 7,881 | 7,816 | 8,508 | 8,796 | 7,243 | 7,297 | 7,422 |
| 2003 | 6,599 | 6,904 | 7,341 | 8,166 | 7,742 | 8,295 | 7,382 | 8,308 | 7,586 | 7,151 | 7,308 | 7,525 |
| 2004 | 6,466 | 6,172 | 5,112 | 6,617 | 7,569 | 7,229 | 7,301 | 7,323 | 6,748 | 6,276 | 6,418 | 6,593 |
| 2005 | 7,117 | 7,000 | 5,960 | 6,946 | 6,349 | 7,107 | 7,512 | 6,873 | 6,809 | 6,565 | 6,963 | 6,876 |
| 2006 | 7,103 | 6,758 | 6,133 | 6,433 | 6,294 | 6,664 | 6,893 | 6,865 | 7,079 | 6,683 | 6,392 | 6,923 |
| 2007 | 6,371 | 5,934 | 6,212 | 6,313 | 6,514 | 6,767 | 6,339 | 6,142 | 6,314 | 6,275 | 6,144 | 6,858 |
| 2008 | 6,800 | 7,410 | 6,314 | 6,299 | 6,276 | 6,308 | 6,531 | 7,000 | 6,446 | 6,933 | 7,247 | 7,028 |
| 2009 | 7,435 | 6,987 | 6,929 | 6,933 | 6,007 | 6,319 | 6,616 | 6,496 | 6,488 | 5,963 | 6,750 | 6,330 |
| 2010 | 6,057 | 6,568 | 6,735 | 6,417 | 6,501 | 6,400 | 6,414 | 6,935 | 7,016 | 6,449 | 6,535 | 6,340 |
| 2011 | 6,558 | 6,173 | 6,457 | 6,381 | 6,287 | 6,002 | 6,112 | 6,060 | 5,967 | 6,802 | 7,057 | 7,395 |
| 2012 | 6,504 | 6,501 | 6,444 | 7,121 | 6,398 | 6,366 | 6,083 | 7,235 | 7,434 | 7,223 | 6,600 | 7,301 |
| 2013 | 6,992 | 7,067 | 6,583 | 7,198 | 7,051 | 6,530 | 6,628 | 6,549 | 6,913 | 6,552 | 6,678 | 6,934 |
| 2014 | 6,051 | 6,424 | 6,695 | 6,896 | 6,948 | 6,426 | 6,967 | 6,391 | 6,568 | 5,812 | 6,510 | 7,660 |
| 2015 | 6,412 | 6,585 | 7,096 | 6,576 | 6,793 | 6,168 | 6,798 | 6,509 | 5,991 | 5,779 | 6,988 | 6,573 |
| 2016 | 6,547 | 6,800 | 7,027 | 6,755 | 6,502 | 6,077 | 6,799 | 7,060 | 7,616 | 7,298 | 6,912 | 6,882 |
| 2017 | 7,079 | 6,696 | 6,931 | 7,116 | 6,917 | 6,302 | 6,554 | 6,910 | 7,001 | 5,998 | 6,138 | 6,920 |
| 2018 | 7,422 | 7,254 | 6,975 | 6,822 | 6,909 | 7,079 | 6,839 | 6,705 | 6,886 | 6,031 | 6,769 | 7,337 |
| 2019 | 6,638 | 6,310 | 6,822 | 7,337 | 6,654 | 6,322 | 6,252 | 6,661 | 6,955 | 5,765 | 6,429 | 6,727 |
| 2020 | 6,654 | 6,445 | 5,762 | 5,795 | 5,749 | 5,855 | 5,981 | 6,047 | 5,987 | 5,679 | 6,197 | 6,651 |
| 2021 | 5,934 | 5,281 | 5,656 | 5,759 | 6,210 | 6,336 | 5,944 | 5,417 | 5,840 | 5,928 | 6,696 | 6,627 |
| 2022 | 6,296 | 6,177 | 6,074 | 5,847 | 5,744 | 5,645 | 6,102 | 5,852 | 5,801 | 5,798 | 6,477 | 5,768 |
| 2023 | 6,273 | 6,646 | 6,071 | 6,147 | 6,404 | 6,566 | 5,831 | 6,753 | 6,521 | 5,535 | 6,543 | 7,337 |
| 2024 | 6,569 | |||||||||||
| - = No Data Reported; -- = Not Applicable; NA = Not Available; W = Withheld to avoid disclosure of individual company data. |
| Release Date: 3/29/2024 |
| Next Release Date: 4/30/2024 |