|
Download Data (XLS File) |
|
||||||||
|
||||||||
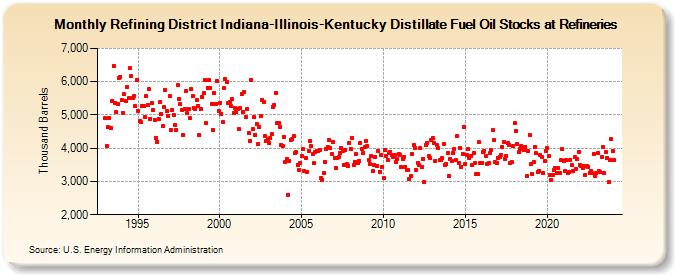
| Refining District Indiana-Illinois-Kentucky Distillate Fuel Oil Stocks at Refineries (Thousand Barrels) | ||||||||
| Year | Jan | Feb | Mar | Apr | May | Jun | Jul | Aug | Sep | Oct | Nov | Dec |
|---|---|---|---|---|---|---|---|---|---|---|---|---|
| 1993 | 4,898 | 4,064 | 4,641 | 4,893 | 4,619 | 5,430 | 6,472 | 5,366 | 5,085 | 5,314 | 6,111 | 6,154 |
| 1994 | 5,460 | 5,066 | 5,620 | 5,426 | 5,850 | 5,497 | 6,401 | 6,159 | 5,514 | 5,581 | 5,254 | 6,062 |
| 1995 | 5,131 | 4,817 | 4,776 | 5,269 | 5,255 | 4,950 | 5,581 | 5,303 | 5,771 | 4,889 | 5,344 | 5,158 |
| 1996 | 4,856 | 4,311 | 4,181 | 4,878 | 5,387 | 5,023 | 4,658 | 5,228 | 5,738 | 5,108 | 4,957 | 5,572 |
| 1997 | 4,560 | 5,157 | 4,998 | 4,691 | 4,557 | 5,900 | 5,485 | 5,315 | 5,154 | 4,397 | 5,180 | 5,733 |
| 1998 | 5,044 | 5,167 | 4,902 | 5,782 | 5,577 | 5,217 | 5,176 | 5,455 | 5,278 | 4,394 | 5,182 | 5,551 |
| 1999 | 5,669 | 6,041 | 4,753 | 5,816 | 6,038 | 5,802 | 5,336 | 4,541 | 5,665 | 5,336 | 6,033 | 5,113 |
| 2000 | 5,366 | 5,033 | 4,775 | 5,796 | 6,072 | 5,984 | 5,373 | 5,375 | 5,254 | 5,466 | 5,063 | 5,206 |
| 2001 | 5,087 | 5,189 | 4,566 | 5,200 | 5,628 | 5,088 | 5,698 | 4,940 | 5,178 | 4,457 | 4,201 | 6,053 |
| 2002 | 4,575 | 4,932 | 4,400 | 4,732 | 4,135 | 4,651 | 4,976 | 5,456 | 5,402 | 4,354 | 4,210 | 4,263 |
| 2003 | 4,167 | 4,312 | 4,413 | 5,237 | 5,300 | 5,659 | 4,745 | 4,747 | 4,645 | 4,109 | 4,079 | 4,350 |
| 2004 | 3,594 | 3,687 | 2,593 | 3,627 | 4,257 | 4,266 | 4,356 | 3,847 | 3,874 | 3,499 | 3,341 | 3,569 |
| 2005 | 3,751 | 3,974 | 3,307 | 3,710 | 3,297 | 3,917 | 4,215 | 4,062 | 3,822 | 3,541 | 3,892 | 3,911 |
| 2006 | 3,930 | 3,946 | 3,108 | 3,038 | 3,259 | 3,597 | 3,964 | 4,047 | 4,241 | 4,005 | 3,823 | 4,171 |
| 2007 | 3,699 | 3,419 | 3,692 | 3,736 | 3,868 | 4,006 | 3,929 | 3,487 | 3,936 | 3,519 | 3,477 | 4,168 |
| 2008 | 3,976 | 4,308 | 3,494 | 3,597 | 3,832 | 3,543 | 3,611 | 4,163 | 3,971 | 3,868 | 4,025 | 4,218 |
| 2009 | 4,063 | 3,646 | 3,531 | 3,774 | 3,301 | 3,501 | 3,732 | 3,473 | 3,908 | 3,297 | 3,809 | 3,447 |
| 2010 | 3,107 | 3,955 | 3,773 | 3,658 | 3,861 | 3,875 | 3,798 | 3,743 | 3,796 | 3,581 | 3,663 | 3,831 |
| 2011 | 3,809 | 3,427 | 3,685 | 3,744 | 3,447 | 3,345 | 3,341 | 3,075 | 3,159 | 3,818 | 4,098 | 4,016 |
| 2012 | 3,345 | 3,567 | 3,496 | 3,996 | 3,437 | 3,688 | 2,977 | 4,104 | 4,143 | 3,751 | 3,696 | 4,250 |
| 2013 | 4,307 | 4,152 | 3,627 | 4,110 | 3,995 | 3,642 | 3,645 | 3,699 | 4,117 | 3,484 | 3,536 | 3,853 |
| 2014 | 3,165 | 3,681 | 3,616 | 3,842 | 3,976 | 3,635 | 4,359 | 3,556 | 4,012 | 3,445 | 3,839 | 4,649 |
| 2015 | 3,536 | 3,807 | 3,977 | 3,699 | 3,757 | 3,489 | 3,861 | 3,556 | 3,214 | 3,218 | 4,176 | 3,554 |
| 2016 | 3,540 | 3,876 | 3,923 | 3,779 | 3,523 | 3,551 | 3,847 | 3,933 | 4,535 | 4,236 | 3,582 | 3,548 |
| 2017 | 3,701 | 3,738 | 3,798 | 4,043 | 4,183 | 3,689 | 3,759 | 4,148 | 4,099 | 3,569 | 3,583 | 4,055 |
| 2018 | 4,743 | 4,526 | 4,131 | 3,871 | 3,967 | 4,069 | 3,971 | 3,952 | 4,045 | 3,151 | 3,902 | 4,409 |
| 2019 | 3,513 | 3,233 | 3,584 | 4,050 | 3,842 | 3,278 | 3,328 | 3,790 | 3,742 | 3,266 | 3,605 | 3,922 |
| 2020 | 3,991 | 3,778 | 3,196 | 3,058 | 3,194 | 3,340 | 3,400 | 3,257 | 3,397 | 3,257 | 3,635 | 3,968 |
| 2021 | 3,616 | 3,318 | 3,635 | 3,269 | 3,293 | 3,653 | 3,481 | 3,300 | 3,730 | 3,371 | 3,686 | 3,890 |
| 2022 | 3,484 | 3,460 | 3,395 | 3,465 | 3,198 | 3,460 | 3,448 | 3,263 | 3,309 | 3,241 | 3,832 | 3,153 |
| 2023 | 3,251 | 3,844 | 3,301 | 3,273 | 3,731 | 4,021 | 3,243 | 3,880 | 3,714 | 2,980 | 3,645 | 4,271 |
| 2024 | 3,907 | |||||||||||
| - = No Data Reported; -- = Not Applicable; NA = Not Available; W = Withheld to avoid disclosure of individual company data. |
| Release Date: 3/29/2024 |
| Next Release Date: 4/30/2024 |