|
Download Data (XLS File) |
|
||||||||
|
||||||||
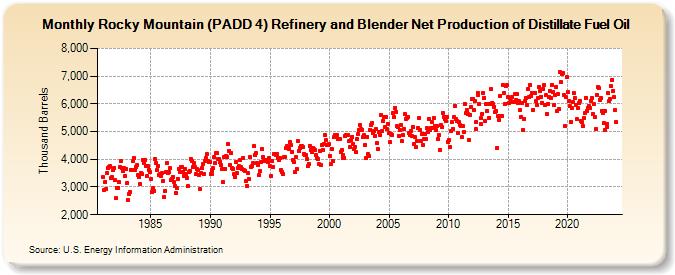
| Rocky Mountain (PADD 4) Refinery and Blender Net Production of Distillate Fuel Oil (Thousand Barrels) | ||||||||
| Year | Jan | Feb | Mar | Apr | May | Jun | Jul | Aug | Sep | Oct | Nov | Dec |
|---|---|---|---|---|---|---|---|---|---|---|---|---|
| 1981 | 3,349 | 2,883 | 3,183 | 2,923 | 3,512 | 3,697 | 3,736 | 3,742 | 3,321 | 3,365 | 3,622 | 3,677 |
| 1982 | 3,241 | 2,586 | 2,948 | 2,971 | 3,176 | 3,714 | 3,928 | 3,670 | 3,584 | 3,669 | 3,401 | 3,651 |
| 1983 | 3,160 | 2,535 | 2,733 | 2,811 | 3,630 | 3,599 | 3,921 | 4,047 | 3,629 | 3,726 | 3,784 | 3,427 |
| 1984 | 3,350 | 3,124 | 3,522 | 3,476 | 3,983 | 3,877 | 3,986 | 3,774 | 3,404 | 3,745 | 3,617 | 3,531 |
| 1985 | 3,293 | 2,818 | 2,949 | 2,856 | 4,005 | 3,855 | 3,602 | 3,763 | 3,447 | 3,451 | 3,403 | 3,495 |
| 1986 | 3,218 | 2,635 | 2,860 | 3,531 | 3,853 | 3,519 | 3,537 | 3,671 | 3,237 | 3,286 | 3,359 | 3,195 |
| 1987 | 3,048 | 2,787 | 2,956 | 3,302 | 3,659 | 3,548 | 3,722 | 3,736 | 3,552 | 3,400 | 3,638 | 3,477 |
| 1988 | 3,341 | 3,026 | 3,540 | 3,587 | 4,024 | 3,945 | 3,716 | 3,864 | 3,705 | 3,453 | 3,632 | 3,616 |
| 1989 | 3,431 | 2,927 | 3,494 | 3,674 | 3,813 | 3,481 | 3,933 | 4,037 | 4,178 | 3,948 | 3,912 | 3,910 |
| 1990 | 3,460 | 3,461 | 3,599 | 3,668 | 4,083 | 3,871 | 4,226 | 4,235 | 4,020 | 3,999 | 3,913 | 3,777 |
| 1991 | 3,663 | 3,176 | 4,074 | 3,651 | 4,132 | 4,094 | 4,546 | 4,313 | 3,794 | 4,228 | 3,680 | 3,666 |
| 1992 | 3,457 | 3,350 | 3,919 | 3,500 | 3,703 | 3,742 | 3,977 | 3,707 | 3,647 | 4,047 | 3,609 | 3,595 |
| 1993 | 3,206 | 3,044 | 3,493 | 3,282 | 4,098 | 3,737 | 3,764 | 3,859 | 4,476 | 4,143 | 4,223 | 3,864 |
| 1994 | 3,800 | 3,419 | 3,571 | 3,889 | 4,377 | 4,069 | 3,943 | 3,932 | 3,965 | 3,959 | 3,897 | 4,055 |
| 1995 | 3,752 | 3,393 | 3,929 | 3,734 | 4,186 | 4,197 | 4,152 | 4,195 | 4,035 | 3,973 | 4,046 | 3,620 |
| 1996 | 3,549 | 3,468 | 4,067 | 4,090 | 4,392 | 4,479 | 4,402 | 4,382 | 4,613 | 4,529 | 4,269 | 3,979 |
| 1997 | 3,915 | 3,523 | 4,093 | 3,658 | 4,655 | 4,284 | 4,403 | 4,467 | 4,463 | 4,454 | 4,200 | 4,162 |
| 1998 | 4,158 | 4,000 | 3,747 | 3,840 | 4,483 | 4,323 | 4,251 | 4,416 | 4,368 | 4,351 | 4,163 | 4,059 |
| 1999 | 3,993 | 3,812 | 4,310 | 3,778 | 4,515 | 4,342 | 4,551 | 4,874 | 4,680 | 4,523 | 4,517 | 4,551 |
| 2000 | 4,136 | 3,823 | 4,381 | 3,949 | 4,794 | 4,870 | 4,823 | 4,888 | 4,735 | 4,732 | 4,742 | 4,273 |
| 2001 | 4,332 | 4,044 | 4,144 | 4,052 | 4,849 | 4,868 | 4,889 | 4,873 | 4,674 | 4,456 | 4,706 | 4,811 |
| 2002 | 4,556 | 4,386 | 4,453 | 4,246 | 4,746 | 4,919 | 5,054 | 5,220 | 5,088 | 5,070 | 4,805 | 4,858 |
| 2003 | 4,523 | 4,048 | 4,814 | 4,180 | 4,116 | 5,068 | 5,226 | 5,299 | 4,958 | 5,006 | 4,850 | 5,085 |
| 2004 | 4,582 | 4,368 | 4,987 | 4,884 | 5,606 | 5,024 | 5,382 | 5,520 | 5,179 | 5,519 | 5,084 | 5,285 |
| 2005 | 4,935 | 4,616 | 4,910 | 4,892 | 5,677 | 5,519 | 5,859 | 5,706 | 5,207 | 5,161 | 4,849 | 5,043 |
| 2006 | 5,229 | 4,644 | 4,874 | 5,099 | 5,624 | 5,467 | 5,503 | 5,526 | 4,945 | 4,885 | 5,012 | 4,827 |
| 2007 | 5,175 | 4,553 | 4,788 | 4,432 | 4,671 | 5,129 | 5,473 | 5,058 | 4,671 | 4,918 | 4,528 | 4,720 |
| 2008 | 4,896 | 4,736 | 5,112 | 4,995 | 5,449 | 5,043 | 5,116 | 5,342 | 5,117 | 5,487 | 5,201 | 5,052 |
| 2009 | 5,214 | 4,715 | 4,878 | 4,352 | 5,236 | 5,148 | 5,677 | 5,508 | 5,452 | 5,365 | 5,537 | 4,636 |
| 2010 | 4,684 | 4,451 | 5,017 | 5,347 | 5,107 | 5,533 | 5,928 | 5,444 | 5,398 | 4,962 | 5,329 | 5,251 |
| 2011 | 5,200 | 4,794 | 5,184 | 4,977 | 6,002 | 5,666 | 5,783 | 5,640 | 4,692 | 5,603 | 5,873 | 6,173 |
| 2012 | 6,188 | 5,774 | 6,107 | 5,080 | 5,349 | 6,392 | 6,325 | 5,989 | 5,268 | 5,476 | 5,645 | 6,399 |
| 2013 | 6,225 | 5,375 | 5,979 | 5,735 | 5,978 | 5,503 | 5,994 | 6,529 | 6,042 | 6,002 | 5,896 | 5,697 |
| 2014 | 5,747 | 4,411 | 5,575 | 5,415 | 6,298 | 5,557 | 5,565 | 6,675 | 6,408 | 6,005 | 6,655 | 6,673 |
| 2015 | 6,254 | 6,034 | 6,217 | 6,086 | 6,234 | 6,071 | 6,059 | 6,350 | 6,130 | 6,339 | 6,048 | 6,110 |
| 2016 | 5,770 | 5,527 | 6,037 | 5,061 | 5,468 | 6,112 | 6,202 | 5,975 | 6,546 | 6,250 | 6,686 | 6,274 |
| 2017 | 6,406 | 5,782 | 6,388 | 6,402 | 6,110 | 5,955 | 6,197 | 6,618 | 6,447 | 6,255 | 6,040 | 6,553 |
| 2018 | 6,671 | 5,961 | 6,304 | 5,638 | 5,999 | 6,254 | 6,478 | 6,225 | 6,691 | 6,432 | 5,961 | 6,310 |
| 2019 | 6,610 | 5,752 | 6,357 | 5,799 | 7,133 | 6,776 | 7,070 | 7,105 | 6,310 | 5,195 | 6,231 | 6,950 |
| 2020 | 6,413 | 6,097 | 5,926 | 5,354 | 5,845 | 6,065 | 6,390 | 6,221 | 5,948 | 5,449 | 5,855 | 6,021 |
| 2021 | 6,115 | 5,391 | 5,343 | 5,192 | 5,489 | 5,657 | 6,220 | 5,753 | 5,856 | 5,936 | 5,864 | 6,116 |
| 2022 | 6,217 | 5,634 | 5,990 | 5,510 | 5,096 | 6,335 | 6,599 | 6,570 | 6,139 | 6,224 | 5,745 | 5,657 |
| 2023 | 5,304 | 5,063 | 5,734 | 5,172 | 5,286 | 6,376 | 6,113 | 6,190 | 6,626 | 6,877 | 6,476 | 6,244 |
| 2024 | 5,788 | 5,338 | ||||||||||
| - = No Data Reported; -- = Not Applicable; NA = Not Available; W = Withheld to avoid disclosure of individual company data. |
| Release Date: 4/30/2024 |
| Next Release Date: 5/31/2024 |