|
Download Data (XLS File) |
|
||||||||
|
||||||||
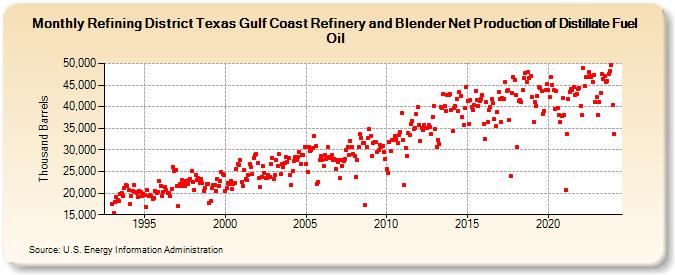
| Refining District Texas Gulf Coast Refinery and Blender Net Production of Distillate Fuel Oil (Thousand Barrels) | ||||||||
| Year | Jan | Feb | Mar | Apr | May | Jun | Jul | Aug | Sep | Oct | Nov | Dec |
|---|---|---|---|---|---|---|---|---|---|---|---|---|
| 1993 | 17,475 | 15,358 | 18,057 | 19,067 | 18,342 | 18,110 | 19,711 | 19,989 | 19,393 | 21,200 | 21,820 | 21,646 |
| 1994 | 20,717 | 17,504 | 19,353 | 20,531 | 21,960 | 20,311 | 19,998 | 19,139 | 20,562 | 20,212 | 19,332 | 19,762 |
| 1995 | 19,514 | 16,862 | 20,669 | 19,321 | 19,454 | 19,334 | 18,534 | 18,872 | 20,447 | 19,960 | 20,217 | 22,745 |
| 1996 | 21,713 | 19,424 | 20,321 | 21,332 | 20,697 | 20,122 | 19,985 | 19,260 | 21,010 | 26,013 | 25,124 | 25,241 |
| 1997 | 21,693 | 16,923 | 22,079 | 21,636 | 23,126 | 22,139 | 21,665 | 22,776 | 22,194 | 23,137 | 23,303 | 25,107 |
| 1998 | 22,518 | 20,826 | 24,289 | 23,144 | 23,461 | 22,449 | 23,270 | 22,361 | 20,552 | 21,178 | 22,028 | 22,059 |
| 1999 | 17,682 | 18,109 | 21,288 | 21,942 | 21,789 | 20,430 | 23,253 | 21,662 | 22,808 | 24,884 | 24,413 | 24,088 |
| 2000 | 20,440 | 21,150 | 22,313 | 22,143 | 22,792 | 20,844 | 22,046 | 22,445 | 25,605 | 26,745 | 26,584 | 27,642 |
| 2001 | 22,521 | 21,752 | 25,445 | 23,278 | 23,123 | 24,077 | 26,726 | 26,077 | 24,341 | 28,097 | 28,831 | 28,971 |
| 2002 | 26,941 | 23,465 | 21,421 | 23,833 | 26,283 | 24,700 | 23,549 | 23,596 | 24,232 | 23,684 | 26,821 | 28,225 |
| 2003 | 23,251 | 24,155 | 27,645 | 26,359 | 28,974 | 24,438 | 26,622 | 26,000 | 27,044 | 28,342 | 27,264 | 28,075 |
| 2004 | 24,091 | 21,845 | 25,127 | 27,518 | 28,430 | 27,707 | 28,256 | 29,455 | 26,808 | 28,741 | 28,856 | 30,707 |
| 2005 | 26,663 | 24,835 | 30,714 | 29,711 | 30,048 | 30,416 | 33,212 | 30,816 | 22,191 | 22,539 | 27,553 | 28,473 |
| 2006 | 27,629 | 26,299 | 28,761 | 27,830 | 30,599 | 28,438 | 28,235 | 28,750 | 27,736 | 28,009 | 25,624 | 27,754 |
| 2007 | 27,271 | 23,404 | 27,761 | 26,346 | 27,405 | 27,890 | 30,024 | 30,600 | 28,893 | 32,064 | 30,617 | 29,007 |
| 2008 | 28,584 | 23,842 | 27,622 | 30,693 | 33,623 | 32,768 | 31,588 | 31,628 | 17,273 | 30,699 | 32,652 | 34,945 |
| 2009 | 33,229 | 28,630 | 31,694 | 31,912 | 31,908 | 29,424 | 29,872 | 31,168 | 30,736 | 31,018 | 29,508 | 27,947 |
| 2010 | 25,674 | 24,655 | 31,882 | 29,671 | 32,386 | 32,332 | 33,155 | 32,461 | 31,654 | 33,447 | 34,034 | 38,440 |
| 2011 | 32,323 | 21,921 | 30,552 | 28,547 | 33,956 | 33,341 | 35,987 | 36,799 | 34,790 | 34,953 | 38,207 | 39,963 |
| 2012 | 35,784 | 32,071 | 35,117 | 34,677 | 35,739 | 34,956 | 35,171 | 35,866 | 35,405 | 33,719 | 37,675 | 40,052 |
| 2013 | 34,893 | 30,739 | 32,312 | 31,333 | 39,898 | 39,779 | 43,010 | 40,202 | 39,083 | 42,820 | 42,613 | 42,978 |
| 2014 | 39,319 | 34,439 | 39,671 | 40,048 | 41,888 | 39,038 | 43,370 | 42,450 | 37,637 | 35,854 | 39,662 | 44,456 |
| 2015 | 41,389 | 36,011 | 41,535 | 39,897 | 39,157 | 40,328 | 43,544 | 41,584 | 40,163 | 41,335 | 41,849 | 42,676 |
| 2016 | 35,997 | 32,593 | 40,984 | 36,390 | 39,216 | 39,849 | 41,715 | 40,758 | 37,080 | 35,461 | 38,847 | 43,385 |
| 2017 | 41,669 | 36,439 | 42,009 | 41,833 | 45,747 | 43,739 | 43,808 | 36,930 | 24,005 | 43,278 | 46,797 | 46,132 |
| 2018 | 42,715 | 30,664 | 41,215 | 41,625 | 41,036 | 43,783 | 46,626 | 47,857 | 45,792 | 48,077 | 46,673 | 47,193 |
| 2019 | 42,327 | 36,507 | 40,995 | 40,239 | 42,580 | 44,516 | 44,301 | 43,613 | 38,292 | 39,087 | 43,750 | 45,140 |
| 2020 | 43,814 | 42,142 | 46,824 | 45,082 | 43,817 | 39,437 | 43,591 | 39,771 | 38,173 | 36,539 | 37,808 | 42,031 |
| 2021 | 38,113 | 20,705 | 33,722 | 41,708 | 43,360 | 44,032 | 43,925 | 44,504 | 42,754 | 42,975 | 44,206 | 44,439 |
| 2022 | 40,213 | 37,982 | 49,048 | 44,687 | 46,810 | 46,878 | 48,057 | 47,149 | 46,798 | 45,824 | 47,445 | 41,191 |
| 2023 | 42,130 | 38,035 | 41,143 | 43,175 | 47,671 | 46,357 | 47,152 | 45,610 | 45,954 | 47,654 | 48,294 | 49,556 |
| 2024 | 40,421 | |||||||||||
| - = No Data Reported; -- = Not Applicable; NA = Not Available; W = Withheld to avoid disclosure of individual company data. |
| Release Date: 3/29/2024 |
| Next Release Date: 4/30/2024 |