|
Download Data (XLS File) |
|
||||||||
|
||||||||
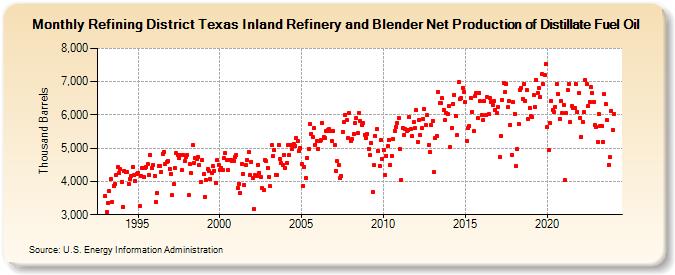
| Refining District Texas Inland Refinery and Blender Net Production of Distillate Fuel Oil (Thousand Barrels) | ||||||||
| Year | Jan | Feb | Mar | Apr | May | Jun | Jul | Aug | Sep | Oct | Nov | Dec |
|---|---|---|---|---|---|---|---|---|---|---|---|---|
| 1993 | 3,549 | 3,089 | 3,363 | 3,698 | 4,063 | 3,384 | 3,866 | 3,910 | 4,183 | 4,424 | 4,253 | 4,363 |
| 1994 | 3,993 | 3,234 | 4,308 | 4,299 | 4,275 | 3,931 | 4,067 | 4,177 | 4,430 | 4,191 | 4,008 | 4,237 |
| 1995 | 4,269 | 3,250 | 4,172 | 4,390 | 4,128 | 4,401 | 4,448 | 4,514 | 4,181 | 4,800 | 4,409 | 4,495 |
| 1996 | 4,176 | 3,378 | 3,650 | 4,460 | 4,473 | 4,298 | 4,835 | 4,896 | 4,528 | 4,580 | 4,623 | 4,383 |
| 1997 | 4,233 | 3,584 | 3,920 | 4,406 | 4,845 | 4,801 | 4,695 | 4,781 | 4,330 | 4,785 | 4,607 | 4,745 |
| 1998 | 4,798 | 3,587 | 4,511 | 4,244 | 5,094 | 4,557 | 4,701 | 4,681 | 4,740 | 4,480 | 3,983 | 4,647 |
| 1999 | 4,218 | 3,547 | 4,029 | 4,374 | 4,306 | 4,074 | 4,269 | 4,455 | 4,326 | 3,954 | 4,638 | 4,496 |
| 2000 | 4,353 | 4,415 | 4,333 | 4,697 | 4,848 | 4,652 | 4,351 | 4,645 | 4,650 | 4,607 | 4,620 | 4,722 |
| 2001 | 4,795 | 3,801 | 3,937 | 3,649 | 4,538 | 4,237 | 3,896 | 4,485 | 4,658 | 4,890 | 4,190 | 4,596 |
| 2002 | 4,097 | 3,166 | 4,184 | 4,174 | 4,503 | 4,262 | 4,130 | 3,791 | 3,751 | 4,646 | 4,601 | 4,414 |
| 2003 | 4,146 | 3,849 | 5,083 | 4,780 | 4,936 | 4,204 | 4,202 | 5,095 | 4,675 | 4,552 | 4,505 | 4,791 |
| 2004 | 4,403 | 4,548 | 5,087 | 4,785 | 5,082 | 4,977 | 5,135 | 5,075 | 5,293 | 5,204 | 4,908 | 5,013 |
| 2005 | 4,526 | 3,877 | 4,430 | 4,109 | 4,719 | 4,981 | 5,724 | 5,434 | 5,330 | 5,601 | 5,110 | 5,212 |
| 2006 | 4,989 | 5,207 | 5,243 | 5,766 | 5,338 | 5,309 | 5,512 | 5,549 | 5,565 | 5,521 | 5,229 | 5,524 |
| 2007 | 5,099 | 4,321 | 4,602 | 4,488 | 4,098 | 4,175 | 5,497 | 5,792 | 5,999 | 5,838 | 5,321 | 6,050 |
| 2008 | 5,223 | 5,274 | 5,432 | 5,752 | 5,906 | 5,444 | 6,068 | 5,804 | 5,698 | 5,757 | 5,403 | 5,310 |
| 2009 | 5,439 | 4,985 | 4,785 | 5,169 | 3,687 | 4,483 | 5,366 | 5,565 | 4,918 | 4,467 | 5,251 | 4,682 |
| 2010 | 4,955 | 4,202 | 4,773 | 5,057 | 5,257 | 4,487 | 4,773 | 5,264 | 5,525 | 5,642 | 5,765 | 5,910 |
| 2011 | 4,975 | 4,053 | 5,608 | 5,392 | 5,567 | 5,518 | 5,541 | 5,937 | 5,576 | 5,352 | 5,782 | 5,620 |
| 2012 | 6,138 | 5,200 | 5,838 | 5,396 | 5,595 | 5,882 | 6,184 | 5,690 | 5,990 | 5,096 | 4,897 | 5,687 |
| 2013 | 5,830 | 4,275 | 5,306 | 5,372 | 6,689 | 6,347 | 6,349 | 6,497 | 6,160 | 5,847 | 6,057 | 6,018 |
| 2014 | 6,271 | 5,026 | 5,610 | 6,342 | 6,608 | 5,956 | 5,383 | 6,995 | 6,465 | 6,516 | 6,821 | 6,676 |
| 2015 | 6,398 | 5,212 | 5,606 | 5,668 | 6,510 | 6,084 | 5,509 | 6,554 | 6,661 | 5,912 | 6,669 | 6,410 |
| 2016 | 6,008 | 5,847 | 6,410 | 6,001 | 6,538 | 6,014 | 6,494 | 6,388 | 6,296 | 6,414 | 6,150 | 6,044 |
| 2017 | 6,225 | 4,740 | 5,352 | 6,453 | 6,950 | 6,677 | 6,934 | 6,224 | 6,413 | 5,700 | 4,808 | 6,376 |
| 2018 | 6,037 | 4,456 | 4,975 | 5,713 | 6,751 | 6,819 | 6,493 | 6,923 | 6,421 | 6,740 | 5,890 | 6,216 |
| 2019 | 5,975 | 5,929 | 6,594 | 6,245 | 7,059 | 6,670 | 6,808 | 6,532 | 7,223 | 6,917 | 7,214 | 7,518 |
| 2020 | 5,623 | 4,938 | 5,768 | 6,426 | 6,154 | 6,093 | 6,241 | 6,921 | 6,638 | 5,887 | 6,404 | 6,064 |
| 2021 | 6,307 | 4,029 | 6,050 | 6,756 | 6,934 | 5,785 | 6,258 | 6,198 | 6,220 | 6,927 | 6,099 | 6,655 |
| 2022 | 5,920 | 5,338 | 5,795 | 6,074 | 7,049 | 6,930 | 6,255 | 6,402 | 6,829 | 6,659 | 6,399 | 5,685 |
| 2023 | 5,633 | 5,189 | 6,016 | 5,676 | 5,656 | 5,191 | 6,616 | 6,326 | 5,842 | 4,503 | 4,727 | 6,126 |
| 2024 | 5,547 | |||||||||||
| - = No Data Reported; -- = Not Applicable; NA = Not Available; W = Withheld to avoid disclosure of individual company data. |
| Release Date: 3/29/2024 |
| Next Release Date: 4/30/2024 |