|
Download Data (XLS File) |
|
||||||||
|
||||||||
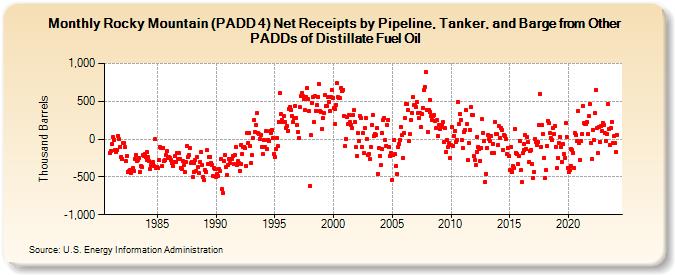
| Rocky Mountain (PADD 4) Net Receipts by Pipeline, Tanker, and Barge from Other PADDs of Distillate Fuel Oil (Thousand Barrels) | ||||||||
| Year | Jan | Feb | Mar | Apr | May | Jun | Jul | Aug | Sep | Oct | Nov | Dec |
|---|---|---|---|---|---|---|---|---|---|---|---|---|
| 1981 | -178 | -155 | -62 | 31 | -8 | -144 | -165 | -142 | 46 | -3 | -100 | -232 |
| 1982 | -257 | -51 | -51 | -111 | -292 | -218 | -438 | -426 | -411 | -442 | -420 | -388 |
| 1983 | -416 | -265 | -205 | -286 | -281 | -246 | -437 | -356 | -363 | -208 | -225 | -198 |
| 1984 | -239 | -273 | -175 | -240 | -294 | -391 | -338 | -337 | -308 | -362 | -4 | -388 |
| 1985 | -366 | -385 | -274 | -105 | -124 | -357 | -112 | -286 | -281 | -216 | -162 | -244 |
| 1986 | -239 | -245 | -278 | -314 | -351 | -301 | -228 | -301 | -183 | -258 | -189 | -261 |
| 1987 | -377 | -396 | -296 | -347 | -438 | -304 | -96 | -243 | -211 | -119 | -316 | -299 |
| 1988 | -502 | -439 | -315 | -279 | -421 | -236 | -372 | -453 | -304 | -173 | -341 | -500 |
| 1989 | -536 | -410 | -429 | -146 | -333 | -236 | -232 | -322 | -339 | -494 | -379 | -398 |
| 1990 | -506 | -458 | -490 | -392 | -425 | -262 | -662 | -707 | -295 | -214 | -375 | -475 |
| 1991 | -342 | -260 | -317 | -268 | -269 | -225 | -328 | -210 | -105 | -348 | -293 | -319 |
| 1992 | -425 | -335 | -78 | -193 | -105 | -104 | -118 | -353 | 81 | -46 | 81 | -94 |
| 1993 | -310 | -211 | 9 | 259 | 91 | 192 | 339 | 78 | 64 | -1 | 55 | -102 |
| 1994 | -201 | -10 | -101 | 102 | -128 | -8 | -27 | 102 | 76 | 125 | 14 | -200 |
| 1995 | -243 | -126 | 19 | -95 | 231 | 604 | 328 | 255 | 223 | 306 | 231 | 144 |
| 1996 | 179 | 113 | 109 | 397 | 430 | 385 | 305 | 226 | 282 | 439 | 282 | 183 |
| 1997 | 94 | 15 | 418 | 565 | 612 | 565 | 535 | 383 | 558 | 675 | 524 | 372 |
| 1998 | -615 | 49 | 482 | 553 | 225 | 568 | 378 | 446 | 560 | 724 | 372 | 362 |
| 1999 | 138 | 276 | 348 | 580 | 437 | 438 | 560 | 494 | 367 | 553 | 651 | 550 |
| 2000 | 405 | 196 | 397 | 454 | 737 | 553 | 543 | 540 | 678 | 631 | 654 | 305 |
| 2001 | -97 | 3 | 293 | 201 | 318 | 220 | 187 | 146 | 321 | 380 | 229 | -108 |
| 2002 | -218 | 79 | -30 | 303 | 284 | -99 | 82 | -182 | 148 | 282 | 3 | -214 |
| 2003 | -200 | -269 | -98 | 183 | 323 | 35 | 74 | 55 | 144 | -456 | -120 | -230 |
| 2004 | -346 | -131 | 76 | 250 | 283 | -17 | -85 | 183 | 256 | -108 | -227 | -179 |
| 2005 | -536 | -214 | -6 | -198 | -356 | -459 | -104 | -59 | -8 | 154 | 50 | -244 |
| 2006 | 82 | 275 | 470 | 464 | 384 | -27 | 62 | 257 | 346 | 553 | 448 | 455 |
| 2007 | 425 | 488 | 345 | 282 | 341 | 156 | 334 | 417 | 646 | 689 | 889 | 385 |
| 2008 | 99 | 382 | 521 | 362 | 305 | 250 | 305 | 314 | 242 | 146 | 254 | 36 |
| 2009 | 185 | 127 | 160 | 183 | 223 | -41 | 143 | -170 | -11 | -106 | -47 | -252 |
| 2010 | -79 | 154 | -87 | 45 | 108 | -38 | -6 | 491 | 201 | 337 | 259 | -10 |
| 2011 | -118 | 92 | 125 | 386 | 194 | -278 | -47 | 122 | 420 | 321 | 319 | -224 |
| 2012 | -283 | -349 | -167 | 26 | -99 | -137 | -287 | -115 | 262 | 85 | -23 | -569 |
| 2013 | -455 | -116 | 60 | 5 | -30 | 44 | -185 | -59 | -185 | 230 | 72 | 63 |
| 2014 | -78 | 170 | 15 | 147 | 123 | -142 | 59 | 40 | -2 | -196 | -114 | -224 |
| 2015 | -412 | -104 | -432 | -362 | -381 | 131 | -179 | -191 | -332 | -221 | -22 | -412 |
| 2016 | -568 | -190 | -144 | -64 | 54 | -134 | 29 | -43 | -302 | -152 | -142 | -326 |
| 2017 | -509 | -431 | 2 | -44 | -73 | -32 | 192 | 601 | -99 | 186 | 70 | -244 |
| 2018 | -517 | -409 | -94 | 243 | 209 | 78 | 12 | -6 | 148 | 67 | 176 | -98 |
| 2019 | -387 | -249 | -50 | 34 | -98 | -298 | -63 | -197 | -253 | 210 | 30 | -377 |
| 2020 | -440 | -412 | -352 | -134 | -147 | -178 | -378 | 77 | 54 | -20 | 374 | -55 |
| 2021 | -273 | -23 | 65 | 440 | 215 | 198 | 205 | 226 | 67 | 300 | 466 | -55 |
| 2022 | -266 | 124 | -12 | 340 | 647 | 148 | -184 | 166 | -36 | 169 | 107 | 217 |
| 2023 | 193 | 79 | -26 | 70 | 460 | 132 | -76 | 149 | 232 | -50 | 37 | -49 |
| 2024 | -176 | |||||||||||
| - = No Data Reported; -- = Not Applicable; NA = Not Available; W = Withheld to avoid disclosure of individual company data. |
| Release Date: 3/29/2024 |
| Next Release Date: 4/30/2024 |