|
Download Data (XLS File) |
|
||||||||
|
||||||||
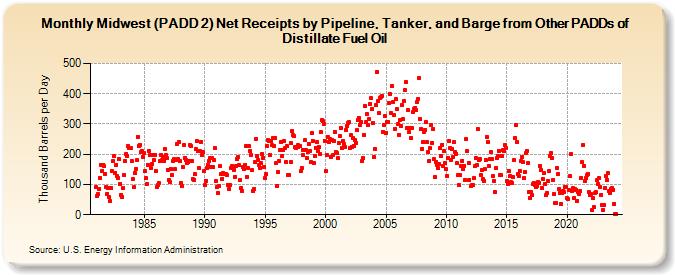
| Midwest (PADD 2) Net Receipts by Pipeline, Tanker, and Barge from Other PADDs of Distillate Fuel Oil (Thousand Barrels per Day) | ||||||||
| Year | Jan | Feb | Mar | Apr | May | Jun | Jul | Aug | Sep | Oct | Nov | Dec |
|---|---|---|---|---|---|---|---|---|---|---|---|---|
| 1981 | 90 | 62 | 68 | 86 | 122 | 165 | 145 | 166 | 160 | 136 | 93 | 70 |
| 1982 | 89 | 57 | 44 | 89 | 143 | 178 | 194 | 139 | 166 | 127 | 122 | 183 |
| 1983 | 101 | 66 | 60 | 88 | 132 | 177 | 202 | 194 | 227 | 219 | 220 | 179 |
| 1984 | 118 | 92 | 138 | 151 | 180 | 258 | 226 | 232 | 206 | 209 | 192 | 204 |
| 1985 | 143 | 120 | 102 | 164 | 211 | 196 | 154 | 168 | 198 | 182 | 199 | 144 |
| 1986 | 91 | 99 | 104 | 176 | 197 | 180 | 190 | 176 | 217 | 196 | 186 | 149 |
| 1987 | 116 | 109 | 151 | 131 | 177 | 183 | 150 | 181 | 234 | 185 | 242 | 179 |
| 1988 | 106 | 94 | 159 | 231 | 188 | 180 | 171 | 173 | 176 | 230 | 227 | 177 |
| 1989 | 117 | 116 | 133 | 217 | 244 | 211 | 153 | 209 | 242 | 199 | 208 | 143 |
| 1990 | 98 | 113 | 154 | 165 | 179 | 186 | 157 | 186 | 158 | 180 | 219 | 111 |
| 1991 | 90 | 72 | 96 | 160 | 134 | 119 | 139 | 136 | 133 | 133 | 130 | 99 |
| 1992 | 84 | 98 | 154 | 161 | 156 | 149 | 126 | 160 | 183 | 190 | 164 | 114 |
| 1993 | 87 | 79 | 157 | 151 | 166 | 227 | 125 | 153 | 226 | 209 | 197 | 147 |
| 1994 | 80 | 85 | 173 | 251 | 194 | 180 | 163 | 156 | 170 | 201 | 189 | 158 |
| 1995 | 122 | 133 | 228 | 247 | 244 | 197 | 244 | 229 | 253 | 227 | 254 | 171 |
| 1996 | 96 | 141 | 179 | 215 | 239 | 195 | 213 | 243 | 222 | 175 | 226 | 132 |
| 1997 | 131 | 175 | 236 | 277 | 263 | 260 | 223 | 222 | 223 | 229 | 226 | 143 |
| 1998 | 156 | 197 | 213 | 246 | 213 | 188 | 206 | 235 | 209 | 173 | 269 | 244 |
| 1999 | 171 | 195 | 222 | 239 | 212 | 224 | 201 | 273 | 313 | 309 | 299 | 245 |
| 2000 | 143 | 199 | 258 | 242 | 249 | 191 | 247 | 196 | 243 | 275 | 206 | 205 |
| 2001 | 188 | 236 | 261 | 286 | 220 | 244 | 234 | 224 | 281 | 294 | 303 | 306 |
| 2002 | 219 | 263 | 225 | 253 | 228 | 247 | 236 | 279 | 314 | 321 | 297 | 308 |
| 2003 | 176 | 187 | 263 | 358 | 306 | 332 | 295 | 315 | 366 | 385 | 351 | 303 |
| 2004 | 192 | 218 | 362 | 473 | 375 | 337 | 387 | 390 | 393 | 275 | 295 | 325 |
| 2005 | 271 | 308 | 308 | 368 | 399 | 335 | 425 | 373 | 329 | 285 | 381 | 348 |
| 2006 | 299 | 265 | 312 | 293 | 362 | 316 | 376 | 411 | 438 | 288 | 346 | 272 |
| 2007 | 288 | 253 | 286 | 341 | 349 | 354 | 346 | 372 | 384 | 451 | 316 | 283 |
| 2008 | 218 | 242 | 274 | 281 | 305 | 240 | 208 | 179 | 219 | 297 | 238 | 282 |
| 2009 | 183 | 124 | 175 | 166 | 153 | 168 | 219 | 193 | 232 | 161 | 211 | 170 |
| 2010 | 150 | 128 | 187 | 244 | 220 | 181 | 218 | 192 | 241 | 207 | 202 | 170 |
| 2011 | 132 | 97 | 130 | 161 | 179 | 150 | 162 | 115 | 250 | 209 | 172 | 116 |
| 2012 | 94 | 99 | 98 | 120 | 160 | 186 | 165 | 282 | 180 | 185 | 132 | 148 |
| 2013 | 117 | 112 | 150 | 181 | 257 | 240 | 162 | 184 | 206 | 183 | 127 | 111 |
| 2014 | 76 | 154 | 186 | 194 | 212 | 131 | 131 | 193 | 215 | 210 | 232 | 221 |
| 2015 | 113 | 100 | 146 | 127 | 107 | 104 | 124 | 180 | 253 | 295 | 240 | 136 |
| 2016 | 129 | 146 | 177 | 190 | 173 | 120 | 140 | 203 | 212 | 170 | 76 | 55 |
| 2017 | 74 | 65 | 101 | 105 | 97 | 90 | 96 | 107 | 106 | 162 | 148 | 89 |
| 2018 | 119 | 137 | 101 | 64 | 72 | 113 | 143 | 194 | 203 | 189 | 116 | 69 |
| 2019 | 38 | 39 | 156 | 134 | 84 | 73 | 36 | 73 | 79 | 74 | 91 | 90 |
| 2020 | 54 | 53 | 81 | 127 | 200 | 79 | 89 | 55 | 84 | 82 | 46 | 74 |
| 2021 | 68 | 77 | 123 | 173 | 231 | 162 | 112 | 120 | 131 | 135 | 74 | 66 |
| 2022 | 68 | 14 | 54 | 24 | 72 | 74 | 114 | 102 | 120 | 91 | 66 | 33 |
| 2023 | 15 | 32 | 88 | 127 | 114 | 137 | 79 | 72 | 86 | 87 | 83 | 37 |
| 2024 | 3 | 3 | ||||||||||
| - = No Data Reported; -- = Not Applicable; NA = Not Available; W = Withheld to avoid disclosure of individual company data. |
| Release Date: 4/30/2024 |
| Next Release Date: 5/31/2024 |