|
Download Data (XLS File) |
|
||||||||
|
||||||||
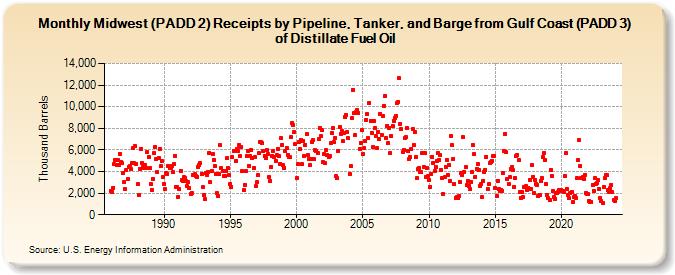
| Midwest (PADD 2) Receipts by Pipeline, Tanker, and Barge from Gulf Coast (PADD 3) of Distillate Fuel Oil (Thousand Barrels) | ||||||||
| Year | Jan | Feb | Mar | Apr | May | Jun | Jul | Aug | Sep | Oct | Nov | Dec |
|---|---|---|---|---|---|---|---|---|---|---|---|---|
| 1986 | 2,228 | 2,123 | 2,498 | 4,669 | 5,092 | 4,621 | 5,075 | 4,595 | 5,658 | 4,904 | 4,758 | 3,854 |
| 1987 | 3,036 | 2,377 | 4,130 | 3,274 | 4,377 | 4,466 | 4,190 | 4,765 | 6,163 | 4,772 | 6,328 | 4,702 |
| 1988 | 2,835 | 1,800 | 4,264 | 6,111 | 4,829 | 4,416 | 4,343 | 4,592 | 4,327 | 5,792 | 5,365 | 4,316 |
| 1989 | 2,835 | 2,296 | 3,307 | 5,704 | 6,273 | 5,161 | 3,918 | 5,231 | 6,090 | 4,505 | 4,958 | 3,480 |
| 1990 | 2,837 | 2,362 | 3,907 | 3,794 | 4,465 | 4,297 | 4,282 | 4,550 | 3,947 | 4,730 | 5,454 | 2,593 |
| 1991 | 2,585 | 1,679 | 2,368 | 4,070 | 3,193 | 3,154 | 3,461 | 3,413 | 3,122 | 2,622 | 2,993 | 2,428 |
| 1992 | 1,910 | 2,035 | 3,700 | 3,713 | 3,725 | 3,582 | 3,501 | 4,426 | 4,602 | 4,743 | 3,769 | 2,541 |
| 1993 | 1,804 | 1,437 | 3,831 | 3,708 | 3,998 | 5,719 | 2,993 | 4,061 | 5,656 | 5,090 | 4,508 | 3,726 |
| 1994 | 1,965 | 1,753 | 3,744 | 6,464 | 4,316 | 4,003 | 3,602 | 3,580 | 4,066 | 5,234 | 4,328 | 3,638 |
| 1995 | 2,851 | 2,583 | 5,320 | 5,942 | 5,886 | 5,012 | 6,108 | 5,915 | 6,491 | 5,448 | 6,251 | 4,021 |
| 1996 | 2,297 | 2,795 | 4,003 | 5,410 | 5,901 | 4,554 | 5,446 | 6,033 | 5,282 | 4,315 | 5,312 | 2,614 |
| 1997 | 3,005 | 3,661 | 5,676 | 6,763 | 6,703 | 6,634 | 5,887 | 5,480 | 5,237 | 6,001 | 5,627 | 3,517 |
| 1998 | 3,079 | 4,419 | 5,460 | 5,905 | 5,355 | 5,011 | 5,542 | 6,127 | 5,407 | 4,686 | 7,100 | 6,455 |
| 1999 | 4,575 | 4,342 | 5,863 | 6,219 | 5,564 | 5,388 | 5,311 | 7,168 | 8,483 | 8,310 | 7,657 | 6,551 |
| 2000 | 3,393 | 4,671 | 6,703 | 6,059 | 6,942 | 4,684 | 6,836 | 5,470 | 6,498 | 7,426 | 5,509 | 5,199 |
| 2001 | 4,571 | 5,129 | 6,722 | 6,920 | 5,125 | 5,980 | 5,878 | 5,689 | 7,007 | 7,991 | 7,275 | 7,817 |
| 2002 | 4,836 | 5,639 | 4,753 | 5,957 | 5,530 | 5,304 | 5,440 | 6,622 | 7,599 | 8,022 | 6,701 | 7,144 |
| 2003 | 3,560 | 3,356 | 5,903 | 8,098 | 7,509 | 7,756 | 6,793 | 7,542 | 9,012 | 9,271 | 7,701 | 7,071 |
| 2004 | 3,795 | 4,488 | 8,908 | 11,575 | 9,407 | 7,356 | 9,476 | 9,679 | 9,444 | 6,101 | 6,658 | 7,834 |
| 2005 | 5,634 | 6,187 | 6,795 | 8,798 | 9,310 | 7,099 | 10,375 | 8,703 | 7,583 | 6,270 | 8,662 | 8,035 |
| 2006 | 7,252 | 6,178 | 7,694 | 6,985 | 9,369 | 7,424 | 9,123 | 10,099 | 11,032 | 7,109 | 8,255 | 6,600 |
| 2007 | 8,071 | 5,704 | 7,296 | 8,215 | 8,678 | 8,993 | 9,168 | 10,332 | 10,452 | 12,610 | 8,422 | 7,907 |
| 2008 | 5,783 | 6,010 | 7,119 | 7,167 | 8,029 | 5,856 | 5,119 | 5,315 | 6,119 | 7,890 | 6,468 | 7,674 |
| 2009 | 5,312 | 3,362 | 4,228 | 4,366 | 3,989 | 3,928 | 5,702 | 4,422 | 5,741 | 3,525 | 4,350 | 3,560 |
| 2010 | 3,210 | 2,593 | 3,781 | 5,381 | 4,799 | 4,060 | 4,431 | 4,932 | 5,725 | 5,066 | 5,496 | 4,145 |
| 2011 | 3,438 | 1,938 | 3,479 | 4,405 | 5,103 | 3,665 | 4,597 | 3,126 | 7,283 | 6,411 | 5,183 | 2,848 |
| 2012 | 1,590 | 1,618 | 1,516 | 1,766 | 3,053 | 3,826 | 3,651 | 7,152 | 3,949 | 4,383 | 2,771 | 3,129 |
| 2013 | 2,696 | 2,387 | 3,041 | 4,000 | 6,438 | 5,618 | 3,513 | 4,267 | 4,706 | 4,182 | 2,659 | 2,819 |
| 2014 | 1,626 | 3,161 | 3,948 | 4,143 | 5,368 | 2,356 | 2,813 | 4,828 | 4,861 | 5,013 | 5,393 | 5,462 |
| 2015 | 2,456 | 1,716 | 3,165 | 2,346 | 2,198 | 2,330 | 2,226 | 3,823 | 5,857 | 7,480 | 5,763 | 3,307 |
| 2016 | 2,839 | 3,467 | 4,264 | 4,399 | 4,107 | 2,611 | 3,422 | 5,476 | 5,542 | 5,029 | 2,093 | 1,593 |
| 2017 | 2,125 | 1,635 | 2,592 | 2,582 | 2,629 | 2,247 | 2,486 | 3,192 | 2,417 | 4,570 | 3,523 | 2,004 |
| 2018 | 3,234 | 2,840 | 2,748 | 1,727 | 1,863 | 3,111 | 3,440 | 5,337 | 5,742 | 5,049 | 2,875 | 1,865 |
| 2019 | 1,514 | 1,329 | 4,159 | 3,600 | 2,183 | 1,612 | 1,470 | 2,043 | 2,050 | 2,131 | 2,313 | 2,303 |
| 2020 | 2,167 | 2,190 | 2,137 | 3,597 | 5,727 | 2,349 | 1,804 | 1,547 | 1,974 | 2,128 | 1,180 | 1,603 |
| 2021 | 1,741 | 1,580 | 3,356 | 5,067 | 6,873 | 4,504 | 3,388 | 3,503 | 3,317 | 3,700 | 2,033 | 1,903 |
| 2022 | 1,917 | 1,224 | 1,155 | 1,197 | 2,782 | 2,221 | 3,364 | 2,821 | 2,924 | 3,230 | 2,391 | 1,538 |
| 2023 | 1,256 | 1,111 | 2,600 | 3,362 | 3,639 | 3,643 | 2,265 | 2,129 | 2,447 | 2,784 | 2,093 | 1,396 |
| 2024 | 1,254 | |||||||||||
| - = No Data Reported; -- = Not Applicable; NA = Not Available; W = Withheld to avoid disclosure of individual company data. |
| Release Date: 3/29/2024 |
| Next Release Date: 4/30/2024 |