|
Download Data (XLS File) |
|
||||||||
|
||||||||
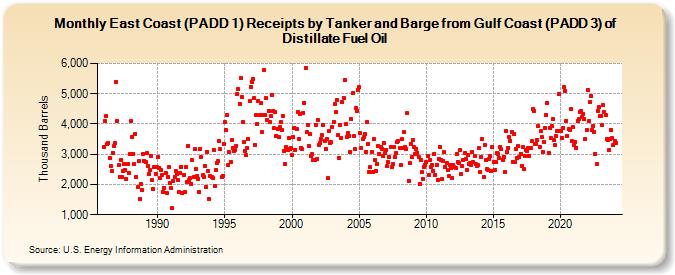
| East Coast (PADD 1) Receipts by Tanker and Barge from Gulf Coast (PADD 3) of Distillate Fuel Oil (Thousand Barrels) | ||||||||
| Year | Jan | Feb | Mar | Apr | May | Jun | Jul | Aug | Sep | Oct | Nov | Dec |
|---|---|---|---|---|---|---|---|---|---|---|---|---|
| 1986 | 3,229 | 4,105 | 4,270 | 3,328 | 3,366 | 2,859 | 2,607 | 2,434 | 3,050 | 3,280 | 3,356 | 5,396 |
| 1987 | 4,099 | 2,639 | 2,250 | 2,818 | 2,234 | 2,431 | 2,690 | 2,490 | 2,194 | 2,686 | 2,394 | 2,995 |
| 1988 | 4,085 | 3,577 | 3,018 | 2,663 | 3,672 | 2,259 | 1,908 | 2,779 | 1,529 | 2,009 | 1,815 | 3,011 |
| 1989 | 2,768 | 2,750 | 3,031 | 2,622 | 2,333 | 2,468 | 2,948 | 2,144 | 1,857 | 2,584 | 2,349 | 2,567 |
| 1990 | 2,920 | 2,554 | 2,199 | 2,480 | 2,317 | 1,737 | 1,890 | 2,389 | 1,733 | 2,260 | 2,584 | 2,044 |
| 1991 | 1,872 | 1,210 | 2,103 | 2,260 | 2,442 | 2,353 | 2,135 | 1,741 | 2,370 | 2,587 | 1,705 | 2,324 |
| 1992 | 1,758 | 2,574 | 2,080 | 3,268 | 2,154 | 2,209 | 2,010 | 2,809 | 2,249 | 3,180 | 2,524 | 2,288 |
| 1993 | 2,190 | 1,755 | 3,169 | 2,899 | 2,301 | 2,249 | 2,609 | 1,924 | 3,083 | 2,453 | 1,505 | 2,269 |
| 1994 | 2,235 | 2,208 | 3,154 | 1,958 | 2,483 | 2,719 | 2,775 | 3,441 | 3,160 | 2,237 | 2,289 | 3,351 |
| 1995 | 4,055 | 3,785 | 4,305 | 2,655 | 3,068 | 2,746 | 3,479 | 3,216 | 3,096 | 3,150 | 3,277 | 5,007 |
| 1996 | 5,143 | 4,676 | 5,515 | 4,903 | 4,050 | 3,400 | 3,115 | 2,970 | 3,216 | 3,509 | 4,751 | 5,235 |
| 1997 | 5,402 | 5,500 | 4,859 | 3,313 | 4,299 | 4,015 | 4,758 | 4,288 | 4,704 | 3,740 | 4,284 | 5,772 |
| 1998 | 4,282 | 4,843 | 4,128 | 4,433 | 4,060 | 4,251 | 4,951 | 4,425 | 3,861 | 4,381 | 3,615 | 3,839 |
| 1999 | 3,565 | 3,896 | 4,076 | 3,795 | 4,280 | 3,118 | 2,682 | 3,227 | 3,126 | 3,529 | 3,184 | 3,204 |
| 2000 | 2,976 | 3,566 | 3,880 | 3,152 | 3,833 | 4,406 | 3,519 | 4,340 | 3,214 | 3,159 | 4,374 | 4,706 |
| 2001 | 5,863 | 3,723 | 3,978 | 3,262 | 3,668 | 2,943 | 3,000 | 2,814 | 2,812 | 3,977 | 2,841 | 4,126 |
| 2002 | 3,314 | 3,380 | 3,488 | 3,619 | 3,972 | 3,450 | 3,174 | 3,514 | 2,210 | 3,778 | 3,384 | 3,391 |
| 2003 | 3,885 | 4,081 | 4,674 | 4,392 | 4,794 | 3,634 | 2,864 | 3,965 | 3,540 | 4,718 | 4,868 | 5,446 |
| 2004 | 3,986 | 3,578 | 3,698 | 3,615 | 3,077 | 4,153 | 5,011 | 3,590 | 3,181 | 4,522 | 4,442 | 5,131 |
| 2005 | 5,212 | 3,696 | 3,214 | 3,491 | 3,566 | 3,685 | 3,084 | 4,069 | 3,348 | 2,427 | 2,569 | 3,083 |
| 2006 | 2,402 | 3,504 | 2,813 | 2,443 | 2,681 | 3,269 | 3,023 | 3,253 | 3,183 | 2,935 | 3,366 | 3,027 |
| 2007 | 3,150 | 2,597 | 2,742 | 2,899 | 3,231 | 2,566 | 2,671 | 3,227 | 2,893 | 3,051 | 3,420 | 3,434 |
| 2008 | 3,197 | 2,635 | 3,493 | 3,222 | 3,728 | 3,252 | 3,189 | 4,354 | 2,126 | 2,697 | 3,348 | 2,916 |
| 2009 | 3,483 | 3,230 | 3,005 | 3,170 | 3,056 | 2,913 | 2,025 | 2,822 | 2,400 | 2,168 | 2,561 | 2,658 |
| 2010 | 2,728 | 2,949 | 2,322 | 2,818 | 2,587 | 2,655 | 2,446 | 3,017 | 2,329 | 2,645 | 2,164 | 2,857 |
| 2011 | 3,254 | 2,801 | 2,183 | 2,785 | 3,057 | 2,592 | 2,696 | 2,469 | 2,278 | 2,655 | 2,531 | 2,221 |
| 2012 | 2,630 | 2,571 | 2,548 | 3,006 | 2,758 | 2,714 | 3,140 | 2,349 | 2,615 | 2,825 | 3,040 | 2,855 |
| 2013 | 2,490 | 2,982 | 2,687 | 2,704 | 2,646 | 3,086 | 2,749 | 2,949 | 2,693 | 2,599 | 2,642 | 3,195 |
| 2014 | 2,408 | 2,909 | 3,500 | 2,258 | 3,314 | 2,804 | 2,513 | 2,492 | 2,836 | 2,925 | 2,452 | 3,238 |
| 2015 | 2,752 | 2,490 | 2,753 | 3,042 | 2,993 | 2,877 | 3,243 | 3,159 | 2,821 | 2,917 | 2,420 | 3,759 |
| 2016 | 3,060 | 3,216 | 3,563 | 3,446 | 3,746 | 2,754 | 3,677 | 2,728 | 3,166 | 2,876 | 3,274 | 2,896 |
| 2017 | 3,018 | 2,621 | 3,251 | 2,506 | 2,928 | 3,136 | 3,115 | 3,191 | 2,953 | 3,222 | 3,437 | 4,505 |
| 2018 | 4,425 | 3,350 | 3,350 | 3,470 | 3,925 | 3,245 | 3,759 | 3,558 | 3,075 | 3,398 | 3,868 | 4,303 |
| 2019 | 4,686 | 3,053 | 3,875 | 3,522 | 3,922 | 4,162 | 3,460 | 3,294 | 3,590 | 3,770 | 4,992 | 3,767 |
| 2020 | 3,763 | 3,543 | 3,872 | 5,233 | 5,083 | 4,106 | 3,618 | 3,840 | 3,792 | 4,482 | 3,438 | 3,885 |
| 2021 | 3,310 | 3,392 | 3,218 | 4,099 | 4,148 | 4,408 | 4,434 | 4,231 | 4,338 | 4,163 | 3,507 | 3,810 |
| 2022 | 5,139 | 4,092 | 4,737 | 4,921 | 3,794 | 3,937 | 3,734 | 3,012 | 2,667 | 4,424 | 4,551 | 4,265 |
| 2023 | 4,262 | 3,950 | 4,612 | 4,389 | 4,286 | 3,511 | 3,465 | 3,135 | 3,510 | 3,813 | 3,523 | 3,290 |
| 2024 | 3,422 | |||||||||||
| - = No Data Reported; -- = Not Applicable; NA = Not Available; W = Withheld to avoid disclosure of individual company data. |
| Release Date: 3/29/2024 |
| Next Release Date: 4/30/2024 |