|
Download Data (XLS File) |
|
||||||||
|
||||||||
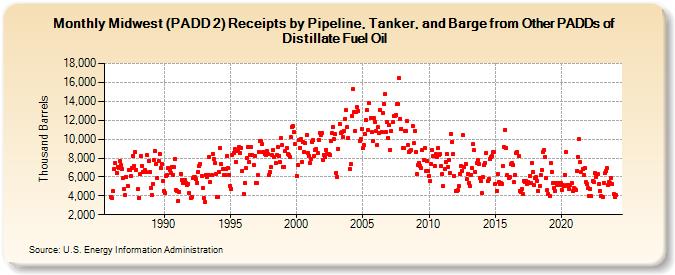
| Midwest (PADD 2) Receipts by Pipeline, Tanker, and Barge from Other PADDs of Distillate Fuel Oil (Thousand Barrels) | ||||||||
| Year | Jan | Feb | Mar | Apr | May | Jun | Jul | Aug | Sep | Oct | Nov | Dec |
|---|---|---|---|---|---|---|---|---|---|---|---|---|
| 1986 | 3,900 | 3,743 | 4,474 | 6,785 | 7,462 | 6,435 | 7,091 | 6,902 | 7,647 | 7,259 | 6,850 | 5,859 |
| 1987 | 4,673 | 4,071 | 6,007 | 5,073 | 6,756 | 6,738 | 6,069 | 6,974 | 8,261 | 7,176 | 8,641 | 6,751 |
| 1988 | 4,680 | 3,809 | 6,265 | 8,186 | 7,192 | 6,547 | 6,504 | 6,701 | 6,476 | 8,269 | 7,730 | 6,509 |
| 1989 | 4,875 | 4,132 | 5,281 | 7,814 | 8,732 | 7,371 | 5,891 | 7,680 | 8,463 | 6,967 | 7,408 | 5,607 |
| 1990 | 4,545 | 4,326 | 6,118 | 6,198 | 6,964 | 6,694 | 6,456 | 7,083 | 6,239 | 7,018 | 7,873 | 4,610 |
| 1991 | 4,515 | 3,490 | 4,434 | 6,304 | 5,674 | 5,405 | 5,604 | 5,707 | 5,371 | 5,132 | 5,271 | 4,285 |
| 1992 | 3,793 | 3,851 | 5,849 | 5,938 | 5,982 | 5,730 | 5,360 | 6,563 | 7,116 | 7,340 | 6,124 | 4,855 |
| 1993 | 3,751 | 3,345 | 6,246 | 5,988 | 6,248 | 8,150 | 5,444 | 6,199 | 8,467 | 7,892 | 7,427 | 6,308 |
| 1994 | 3,892 | 3,889 | 6,528 | 9,071 | 7,320 | 6,830 | 6,215 | 6,220 | 6,788 | 8,203 | 6,978 | 6,239 |
| 1995 | 5,069 | 4,728 | 8,292 | 8,553 | 8,924 | 7,611 | 8,770 | 8,716 | 9,185 | 8,563 | 9,107 | 6,661 |
| 1996 | 4,210 | 5,380 | 6,950 | 8,033 | 9,184 | 7,549 | 8,311 | 9,138 | 8,278 | 7,291 | 8,231 | 5,359 |
| 1997 | 5,343 | 6,168 | 8,628 | 9,783 | 9,759 | 9,468 | 8,662 | 8,458 | 8,347 | 8,757 | 8,465 | 6,227 |
| 1998 | 6,483 | 7,046 | 8,333 | 8,860 | 8,136 | 7,494 | 8,337 | 9,153 | 8,241 | 7,602 | 10,100 | 9,328 |
| 1999 | 7,071 | 7,062 | 8,749 | 9,068 | 8,432 | 8,336 | 8,158 | 10,172 | 11,234 | 11,383 | 10,713 | 9,500 |
| 2000 | 6,133 | 7,275 | 9,884 | 9,037 | 9,996 | 7,615 | 9,651 | 8,634 | 9,597 | 10,420 | 8,556 | 8,203 |
| 2001 | 7,494 | 7,937 | 9,700 | 9,853 | 8,212 | 8,870 | 8,948 | 8,483 | 9,954 | 10,629 | 10,400 | 10,663 |
| 2002 | 7,791 | 8,304 | 8,060 | 8,878 | 8,435 | 8,451 | 8,292 | 9,823 | 10,626 | 11,285 | 9,959 | 10,521 |
| 2003 | 6,424 | 5,990 | 8,999 | 11,602 | 10,693 | 10,733 | 10,250 | 10,860 | 12,179 | 13,045 | 11,248 | 10,156 |
| 2004 | 6,817 | 7,337 | 12,470 | 15,256 | 12,877 | 10,879 | 12,916 | 13,344 | 12,989 | 9,800 | 10,010 | 11,082 |
| 2005 | 9,081 | 9,367 | 10,496 | 12,017 | 13,112 | 10,958 | 13,773 | 12,223 | 10,715 | 9,795 | 12,195 | 11,823 |
| 2006 | 10,833 | 9,426 | 11,231 | 10,636 | 13,120 | 10,792 | 12,759 | 13,760 | 14,762 | 10,755 | 11,822 | 10,157 |
| 2007 | 11,443 | 8,886 | 10,894 | 11,780 | 12,469 | 12,452 | 12,510 | 13,672 | 13,714 | 16,456 | 12,153 | 11,097 |
| 2008 | 9,068 | 9,019 | 10,885 | 10,865 | 11,953 | 9,361 | 8,597 | 8,706 | 8,820 | 11,435 | 9,551 | 10,864 |
| 2009 | 8,667 | 6,306 | 7,302 | 7,494 | 7,182 | 6,915 | 8,840 | 7,817 | 9,035 | 6,583 | 7,646 | 6,628 |
| 2010 | 6,070 | 5,572 | 7,331 | 8,834 | 8,237 | 7,161 | 8,422 | 8,124 | 9,011 | 8,294 | 8,415 | 7,139 |
| 2011 | 6,304 | 4,989 | 6,848 | 7,585 | 8,444 | 7,057 | 7,801 | 6,403 | 10,575 | 9,739 | 8,449 | 6,098 |
| 2012 | 4,511 | 4,494 | 4,586 | 4,993 | 6,287 | 7,195 | 6,672 | 10,390 | 7,054 | 7,371 | 5,791 | 6,339 |
| 2013 | 5,340 | 4,986 | 6,219 | 6,960 | 9,460 | 8,805 | 6,504 | 7,446 | 7,750 | 7,393 | 5,904 | 5,517 |
| 2014 | 4,260 | 5,979 | 7,288 | 7,473 | 8,537 | 5,529 | 5,806 | 7,895 | 8,135 | 8,227 | 8,593 | 8,663 |
| 2015 | 5,240 | 4,494 | 6,295 | 5,478 | 5,242 | 5,351 | 5,291 | 7,159 | 9,166 | 10,989 | 9,053 | 6,157 |
| 2016 | 5,872 | 5,950 | 7,319 | 7,466 | 7,271 | 5,453 | 6,192 | 8,513 | 8,641 | 8,175 | 4,553 | 4,409 |
| 2017 | 4,727 | 4,142 | 5,600 | 5,437 | 5,554 | 5,262 | 5,481 | 6,094 | 5,336 | 7,517 | 6,515 | 5,093 |
| 2018 | 5,858 | 5,949 | 5,601 | 4,536 | 5,028 | 6,197 | 6,765 | 8,618 | 8,880 | 8,149 | 5,898 | 4,605 |
| 2019 | 4,202 | 3,929 | 7,435 | 6,569 | 5,320 | 4,791 | 4,528 | 5,355 | 5,124 | 5,355 | 5,094 | 5,313 |
| 2020 | 4,645 | 5,139 | 4,997 | 6,221 | 8,644 | 5,159 | 5,070 | 4,768 | 5,128 | 5,360 | 4,498 | 4,814 |
| 2021 | 4,683 | 4,610 | 6,626 | 8,082 | 9,982 | 7,542 | 6,478 | 6,838 | 6,222 | 6,934 | 5,458 | 5,212 |
| 2022 | 4,775 | 3,984 | 4,708 | 3,949 | 5,551 | 5,508 | 6,396 | 6,034 | 6,305 | 6,255 | 5,283 | 4,492 |
| 2023 | 3,957 | 3,897 | 5,397 | 6,405 | 6,670 | 6,903 | 5,110 | 5,453 | 5,369 | 5,883 | 5,224 | 4,140 |
| 2024 | 3,874 | |||||||||||
| - = No Data Reported; -- = Not Applicable; NA = Not Available; W = Withheld to avoid disclosure of individual company data. |
| Release Date: 3/29/2024 |
| Next Release Date: 4/30/2024 |