|
Download Data (XLS File) |
|
||||||||
|
||||||||
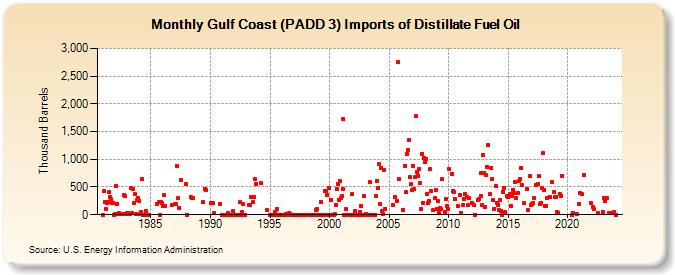
| Gulf Coast (PADD 3) Imports of Distillate Fuel Oil (Thousand Barrels) | ||||||||
| Year | Jan | Feb | Mar | Apr | May | Jun | Jul | Aug | Sep | Oct | Nov | Dec |
|---|---|---|---|---|---|---|---|---|---|---|---|---|
| 1981 | 0 | 434 | 229 | 98 | 216 | 224 | 404 | 315 | 278 | 217 | 219 | 0 |
| 1982 | 21 | 516 | 200 | 20 | 28 | 10 | 11 | 12 | 12 | 357 | 331 | 8 |
| 1983 | 30 | 29 | 6 | 5 | 490 | 23 | 459 | 207 | 374 | 8 | 257 | 301 |
| 1984 | 245 | 5 | 51 | 652 | 1 | 1 | 1 | 71 | 1 | 0 | 0 | |
| 1985 | 200 | 226 | 1 | 225 | 203 | |||||||
| 1986 | 163 | 364 | 164 | 173 | ||||||||
| 1987 | 200 | 189 | 881 | 296 | 118 | 625 | 546 | |||||
| 1988 | 2 | 311 | 301 | 299 | ||||||||
| 1989 | 225 | 471 | 446 | |||||||||
| 1990 | 207 | 203 | 30 | 190 | ||||||||
| 1991 | 0 | 0 | 0 | 0 | 0 | 0 | 23 | 0 | 0 | 0 | 0 | 60 |
| 1992 | 0 | 0 | 0 | 0 | 0 | 0 | 222 | 0 | 54 | 187 | 0 | 0 |
| 1993 | 180 | 174 | 315 | 227 | 312 | 637 | 554 | |||||
| 1994 | 572 | 87 | ||||||||||
| 1995 | 0 | 0 | 0 | 0 | 0 | 48 | 0 | 111 | 0 | 0 | 0 | 0 |
| 1996 | 0 | 0 | 0 | 0 | 7 | 0 | 8 | 22 | 4 | 0 | 0 | 0 |
| 1997 | 0 | 0 | 0 | 0 | 0 | 0 | 0 | 0 | 0 | 0 | 0 | 0 |
| 1998 | 0 | 0 | 0 | 0 | 0 | 0 | 0 | 0 | 0 | 0 | 89 | 110 |
| 1999 | 0 | 0 | 0 | 237 | 0 | 0 | 0 | 430 | 429 | 359 | 0 | 485 |
| 2000 | 0 | 268 | 0 | 0 | 0 | 8 | 181 | 462 | 563 | 274 | 610 | 305 |
| 2001 | 330 | 461 | 1,724 | 0 | 0 | 95 | 0 | 0 | 0 | 0 | 3 | 375 |
| 2002 | 0 | 0 | 59 | 0 | 0 | 0 | 0 | 45 | 152 | 0 | 0 | 338 |
| 2003 | 0 | 10 | 0 | 3 | 0 | 582 | 0 | 0 | 0 | 0 | 0 | 329 |
| 2004 | 604 | 484 | 907 | 199 | 851 | 74 | 15 | 809 | 100 | |||
| 2005 | 169 | 318 | 251 | 2,752 | 640 | |||||||
| 2006 | 92 | 885 | 401 | 1,103 | 1,174 | 1,349 | 686 | 545 | 437 | |||
| 2007 | 883 | 459 | 680 | 1,775 | 776 | 693 | 831 | 571 | 110 | 1,096 | 220 | 1,026 |
| 2008 | 956 | 1,005 | 373 | 211 | 249 | 819 | 426 | 78 | 298 | 442 | ||
| 2009 | 99 | 239 | 25 | 121 | 98 | 643 | 56 | 280 | 152 | 110 | ||
| 2010 | 831 | 736 | 435 | 413 | 276 | 164 | 349 | |||||
| 2011 | 38 | 174 | 284 | 379 | 313 | 169 | 308 | 217 | ||||
| 2012 | 180 | 2 | 267 | 284 | 332 | 749 | 183 | 1,080 | ||||
| 2013 | 755 | 131 | 711 | 867 | 1,253 | 369 | 848 | 641 | 260 | 108 | ||
| 2014 | 517 | 211 | 180 | 84 | 273 | 59 | 3 | 418 | 480 | 55 | 346 | |
| 2015 | 315 | 381 | 165 | 331 | 448 | 384 | 586 | 309 | 395 | 601 | ||
| 2016 | 646 | 843 | 528 | 220 | 461 | 83 | 693 | 168 | ||||
| 2017 | 191 | 220 | 299 | 539 | 555 | 692 | 200 | 207 | 475 | 1,109 | ||
| 2018 | 443 | 157 | 151 | 293 | 326 | 586 | 412 | 318 | ||||
| 2019 | 319 | 50 | 38 | 370 | 330 | 706 | ||||||
| 2020 | 2 | 36 | 9 | 187 | ||||||||
| 2021 | 400 | 375 | 711 | 220 | ||||||||
| 2022 | 136 | 110 | 25 | 57 | ||||||||
| 2023 | 300 | 240 | 293 | 26 | 27 | 28 | 44 | |||||
| - = No Data Reported; -- = Not Applicable; NA = Not Available; W = Withheld to avoid disclosure of individual company data. |
| Release Date: 3/29/2024 |
| Next Release Date: 4/30/2024 |