|
Download Data (XLS File) |
|
||||||||
|
||||||||
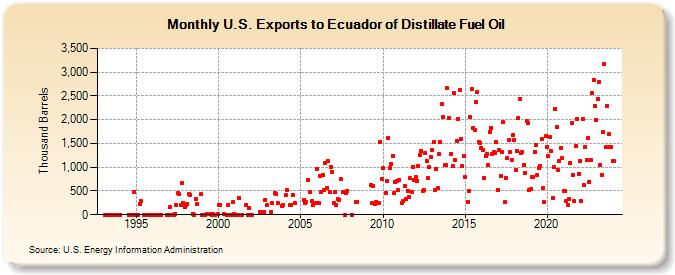
| U.S. Exports to Ecuador of Distillate Fuel Oil (Thousand Barrels) | ||||||||
| Year | Jan | Feb | Mar | Apr | May | Jun | Jul | Aug | Sep | Oct | Nov | Dec |
|---|---|---|---|---|---|---|---|---|---|---|---|---|
| 1993 | 0 | 1 | 1 | 0 | 1 | |||||||
| 1994 | 0 | 0 | 0 | 0 | 486 | 0 | ||||||
| 1995 | 1 | 220 | 290 | 0 | 0 | 1 | 3 | |||||
| 1996 | 1 | 1 | 0 | 2 | 0 | 1 | ||||||
| 1997 | 155 | 2 | 0 | 8 | 208 | 452 | 430 | 200 | 667 | 247 | 165 | |
| 1998 | 212 | 218 | 434 | 420 | 8 | 1 | 332 | 217 | 429 | |||
| 1999 | 0 | 1 | 0 | 10 | 9 | 0 | 8 | 2 | 8 | |||
| 2000 | 212 | 212 | 8 | 1 | 206 | 0 | 260 | 10 | ||||
| 2001 | 0 | 0 | 352 | 0 | 210 | 0 | 139 | 0 | ||||
| 2002 | 0 | 47 | 58 | 320 | 195 | |||||||
| 2003 | 54 | 249 | 454 | 430 | 250 | 180 | 210 | |||||
| 2004 | 414 | 521 | 202 | 200 | 424 | 244 | ||||||
| 2005 | 316 | 241 | 270 | 740 | 480 | 280 | 210 | 241 | ||||
| 2006 | 965 | 238 | 820 | 485 | 845 | 511 | 1,084 | 554 | 1,126 | 480 | 998 | 889 |
| 2007 | 250 | 470 | 208 | 335 | 305 | 745 | 474 | 1 | 467 | 494 | ||
| 2008 | 0 | 276 | 261 | |||||||||
| 2009 | 626 | 240 | 609 | 234 | 275 | 238 | 1,527 | 760 | ||||
| 2010 | 977 | 466 | 713 | 1,617 | 976 | 1,057 | 1,239 | 458 | 685 | 708 | 521 | |
| 2011 | 724 | 242 | 285 | 602 | 332 | 501 | 364 | 775 | 480 | 1,013 | 737 | |
| 2012 | 797 | 710 | 1,018 | 1,267 | 1,343 | 489 | 525 | 1,308 | 1,135 | 776 | 998 | 1,208 |
| 2013 | 1,372 | 1,529 | 519 | 963 | 553 | 1,273 | 1,531 | 2,321 | 2,050 | 1,036 | 1,051 | 2,659 |
| 2014 | 2,030 | 1,268 | 1,033 | 2,559 | 1,148 | 1,554 | 2,009 | 2,634 | 1,586 | 1,031 | 1,246 | |
| 2015 | 787 | 263 | 490 | 2,057 | 2,651 | 1,821 | 1,790 | 2,375 | 2,589 | 1,540 | 1,519 | |
| 2016 | 1,410 | 1,367 | 780 | 1,232 | 1,272 | 1,042 | 1,731 | 1,829 | 1,278 | 1,311 | 1,299 | 1,531 |
| 2017 | 521 | 1,362 | 825 | 1,311 | 1,941 | 264 | 782 | 1,189 | 1,566 | 1,318 | 1,153 | 1,674 |
| 2018 | 1,570 | 939 | 1,342 | 2,044 | 2,436 | 1,294 | 1,324 | 1,056 | 878 | 1,979 | 1,925 | 530 |
| 2019 | 543 | 796 | 786 | 1,314 | 1,458 | 832 | 991 | 1,029 | 1,597 | 556 | 259 | 1,651 |
| 2020 | 1,433 | 1,227 | 1,640 | 1,341 | 347 | 1,006 | 2,234 | 1,852 | 942 | 1,133 | 1,402 | 1,188 |
| 2021 | 497 | 493 | 285 | 214 | 333 | 1,094 | 1,932 | 841 | 285 | 1,445 | 2,024 | 864 |
| 2022 | 1,133 | 285 | 2,019 | 617 | 1,420 | 1,153 | 1,622 | 694 | 1,141 | 2,561 | 2,841 | 2,298 |
| 2023 | 1,997 | 2,436 | 2,794 | 1,056 | 844 | 1,735 | 3,165 | 1,418 | 2,290 | 1,701 | 1,427 | 1,429 |
| 2024 | 1,134 | |||||||||||
| - = No Data Reported; -- = Not Applicable; NA = Not Available; W = Withheld to avoid disclosure of individual company data. |
| Release Date: 3/29/2024 |
| Next Release Date: 4/30/2024 |