|
Download Data (XLS File) |
|
||||||||
|
||||||||
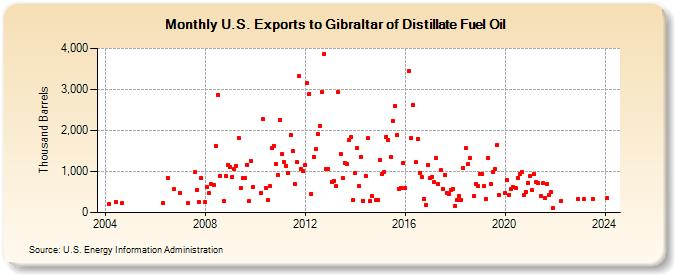
| U.S. Exports to Gibraltar of Distillate Fuel Oil (Thousand Barrels) | ||||||||
| Year | Jan | Feb | Mar | Apr | May | Jun | Jul | Aug | Sep | Oct | Nov | Dec |
|---|---|---|---|---|---|---|---|---|---|---|---|---|
| 2004 | 220 | 253 | 224 | |||||||||
| 2006 | 238 | 850 | 563 | |||||||||
| 2007 | 483 | 222 | 981 | 558 | 260 | 839 | ||||||
| 2008 | 263 | 615 | 466 | 684 | 666 | 1,633 | 2,857 | 898 | 281 | 887 | 1,162 | |
| 2009 | 1,113 | 876 | 1,058 | 1,143 | 1,827 | 600 | 831 | 845 | 1,165 | 273 | 1,260 | 631 |
| 2010 | 476 | 2,272 | 600 | 295 | 636 | 1,570 | 1,622 | 1,195 | 914 | |||
| 2011 | 2,263 | 1,435 | 1,225 | 1,146 | 976 | 1,899 | 1,491 | 697 | 1,220 | 3,320 | 1,073 | 1,009 |
| 2012 | 1,153 | 3,146 | 2,890 | 456 | 1,365 | 1,541 | 1,918 | 2,118 | 2,944 | 3,864 | 1,056 | 1,073 |
| 2013 | 733 | 773 | 642 | 2,928 | 1,424 | 837 | 1,209 | 1,181 | 1,762 | 1,838 | 303 | |
| 2014 | 958 | 1,562 | 644 | 1,358 | 288 | 898 | 1,806 | 274 | 412 | 306 | 304 | |
| 2015 | 1,287 | 946 | 985 | 1,848 | 1,775 | 1,347 | 2,240 | 2,591 | 1,900 | 585 | 605 | 1,205 |
| 2016 | 602 | 3,452 | 1,806 | 2,616 | 1,225 | 1,804 | 956 | 858 | 325 | 196 | 1,155 | |
| 2017 | 831 | 862 | 739 | 1,326 | 685 | 1,027 | 581 | 923 | 485 | 462 | 541 | 563 |
| 2018 | 161 | 297 | 412 | 299 | 1,089 | 1,565 | 1,174 | 1,335 | 403 | 691 | 646 | |
| 2019 | 947 | 945 | 638 | 325 | 1,320 | 690 | 988 | 1,056 | 1,643 | 418 | ||
| 2020 | 465 | 792 | 439 | 582 | 620 | 594 | 849 | 930 | 996 | 425 | 510 | 720 |
| 2021 | 885 | 538 | 929 | 739 | 719 | 407 | 709 | 366 | 694 | 422 | 497 | 118 |
| 2022 | 280 | 336 | ||||||||||
| 2023 | 327 | 330 | ||||||||||
| - = No Data Reported; -- = Not Applicable; NA = Not Available; W = Withheld to avoid disclosure of individual company data. |
| Release Date: 3/29/2024 |
| Next Release Date: 4/30/2024 |