|
Download Data (XLS File) |
|
||||||||
|
||||||||
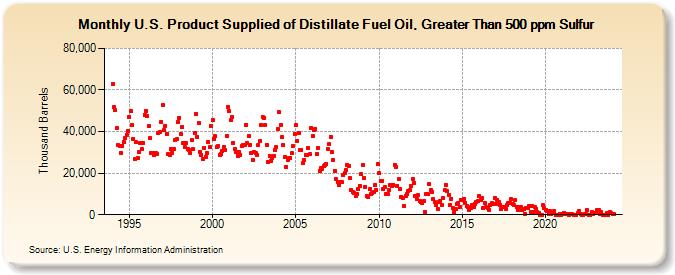
| U.S. Product Supplied of Distillate Fuel Oil, Greater Than 500 ppm Sulfur (Thousand Barrels) | ||||||||
| Year | Jan | Feb | Mar | Apr | May | Jun | Jul | Aug | Sep | Oct | Nov | Dec |
|---|---|---|---|---|---|---|---|---|---|---|---|---|
| 1994 | 62,973 | 51,794 | 50,177 | 41,501 | 33,560 | 32,965 | 29,825 | 33,251 | 35,177 | 36,837 | 38,464 | 40,484 |
| 1995 | 47,129 | 49,847 | 43,277 | 36,336 | 26,727 | 34,822 | 27,171 | 30,160 | 34,703 | 31,502 | 34,519 | 48,001 |
| 1996 | 50,106 | 47,681 | 42,527 | 36,696 | 29,833 | 29,532 | 28,907 | 29,613 | 29,320 | 39,384 | 39,953 | 44,785 |
| 1997 | 52,700 | 40,542 | 42,861 | 38,984 | 29,065 | 28,608 | 31,476 | 29,852 | 31,752 | 35,934 | 36,208 | 44,654 |
| 1998 | 46,645 | 38,821 | 42,403 | 34,550 | 32,754 | 34,445 | 31,397 | 31,148 | 29,453 | 36,122 | 31,408 | 39,283 |
| 1999 | 48,606 | 37,528 | 44,255 | 30,388 | 28,943 | 26,749 | 32,164 | 27,966 | 29,658 | 35,168 | 32,383 | 42,616 |
| 2000 | 45,558 | 36,523 | 37,658 | 32,642 | 32,954 | 28,696 | 29,310 | 30,818 | 32,711 | 31,209 | 37,892 | 51,867 |
| 2001 | 49,881 | 45,492 | 46,999 | 34,559 | 31,532 | 30,111 | 28,461 | 30,376 | 28,959 | 33,071 | 33,669 | 33,434 |
| 2002 | 43,379 | 34,271 | 37,851 | 33,604 | 29,885 | 26,516 | 30,150 | 29,561 | 28,817 | 33,683 | 35,221 | 43,170 |
| 2003 | 47,133 | 46,565 | 43,131 | 33,734 | 25,454 | 28,417 | 25,890 | 27,183 | 28,434 | 30,955 | 32,463 | 41,145 |
| 2004 | 49,242 | 43,082 | 37,437 | 33,364 | 27,718 | 23,104 | 26,454 | 27,292 | 27,214 | 29,475 | 32,957 | 38,850 |
| 2005 | 43,147 | 35,636 | 39,462 | 31,090 | 31,173 | 24,697 | 26,326 | 28,937 | 28,953 | 32,065 | 29,068 | 41,879 |
| 2006 | 37,978 | 40,727 | 41,188 | 29,410 | 32,199 | 21,232 | 22,244 | 21,976 | 23,216 | 23,809 | 24,581 | 31,503 |
| 2007 | 33,842 | 37,382 | 30,097 | 26,206 | 21,079 | 16,982 | 15,551 | 14,127 | 15,809 | 15,754 | 18,979 | 20,168 |
| 2008 | 21,679 | 24,007 | 23,537 | 17,569 | 11,843 | 11,008 | 10,606 | 8,826 | 10,153 | 12,320 | 13,959 | 19,499 |
| 2009 | 23,850 | 17,547 | 13,478 | 8,804 | 8,468 | 12,137 | 9,903 | 10,276 | 10,827 | 14,219 | 12,050 | 24,227 |
| 2010 | 19,878 | 16,340 | 16,278 | 12,355 | 13,239 | 9,907 | 10,186 | 12,088 | 14,113 | 13,928 | 14,442 | 24,040 |
| 2011 | 23,106 | 13,976 | 17,275 | 12,286 | 8,574 | 7,804 | 4,421 | 9,005 | 9,927 | 11,515 | 11,682 | 13,864 |
| 2012 | 17,253 | 15,441 | 8,809 | 7,658 | 9,271 | 6,434 | 5,912 | 5,711 | 6,610 | 1,489 | 9,726 | 10,189 |
| 2013 | 14,922 | 12,040 | 11,143 | 7,534 | 6,019 | 4,823 | 2,887 | 6,005 | 6,621 | 4,899 | 7,922 | 11,715 |
| 2014 | 14,372 | 11,311 | 9,646 | 4,713 | 7,751 | 3,011 | 1,457 | 2,705 | 4,981 | 5,607 | 3,759 | 6,950 |
| 2015 | 7,068 | 7,684 | 5,835 | 4,198 | 3,698 | 2,227 | 3,207 | 4,595 | 3,682 | 5,271 | 6,170 | 6,670 |
| 2016 | 9,087 | 7,263 | 8,028 | 3,248 | 5,863 | 3,504 | 3,364 | 2,369 | 4,588 | 5,443 | 5,350 | 8,245 |
| 2017 | 5,068 | 7,280 | 6,337 | 4,824 | 2,719 | 3,487 | 3,911 | 2,857 | 4,823 | 5,417 | 5,840 | 7,325 |
| 2018 | 5,262 | 4,657 | 6,903 | 3,577 | 2,112 | 3,485 | 3,657 | 2,260 | 2,833 | 301 | 3,183 | 3,255 |
| 2019 | 4,313 | 1,486 | 4,412 | 1,402 | 3,614 | 2,814 | 1,264 | 856 | 30 | 38 | 4,532 | 3,009 |
| 2020 | 2,311 | 1,802 | 265 | 1,572 | 104 | 1,409 | 1,633 | 75 | 36 | 55 | 522 | 35 |
| 2021 | 387 | 1,050 | 224 | 561 | 106 | 95 | 166 | 162 | 57 | 13 | 82 | 882 |
| 2022 | 1,742 | 352 | 50 | 19 | 372 | 287 | 2,100 | 34 | 66 | 1,130 | 154 | 917 |
| 2023 | 926 | 2,260 | 2,136 | 130 | 1,251 | 22 | 34 | 79 | 651 | 99 | 1,076 | 701 |
| 2024 | 424 | |||||||||||
| - = No Data Reported; -- = Not Applicable; NA = Not Available; W = Withheld to avoid disclosure of individual company data. |
| Release Date: 3/29/2024 |
| Next Release Date: 4/30/2024 |