|
Download Data (XLS File) |
|
||||||||
|
||||||||
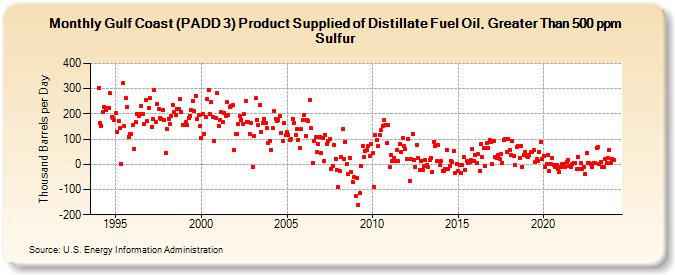
| Gulf Coast (PADD 3) Product Supplied of Distillate Fuel Oil, Greater Than 500 ppm Sulfur (Thousand Barrels per Day) | ||||||||
| Year | Jan | Feb | Mar | Apr | May | Jun | Jul | Aug | Sep | Oct | Nov | Dec |
|---|---|---|---|---|---|---|---|---|---|---|---|---|
| 1994 | 302 | 165 | 153 | 207 | 226 | 215 | 224 | 223 | 281 | 187 | 182 | 174 |
| 1995 | 203 | 129 | 173 | 144 | 0 | 321 | 151 | 263 | 227 | 109 | 122 | 121 |
| 1996 | 154 | 62 | 167 | 201 | 193 | 198 | 231 | 198 | 158 | 254 | 171 | 225 |
| 1997 | 263 | 147 | 178 | 293 | 169 | 240 | 220 | 182 | 181 | 215 | 175 | 46 |
| 1998 | 139 | 181 | 159 | 192 | 235 | 206 | 197 | 218 | 219 | 258 | 207 | 156 |
| 1999 | 155 | 167 | 154 | 184 | 191 | 214 | 251 | 212 | 272 | 178 | 194 | 152 |
| 2000 | 106 | 200 | 121 | 186 | 260 | 293 | 198 | 246 | 187 | 94 | 185 | 283 |
| 2001 | 153 | 175 | 206 | 166 | 205 | 191 | 246 | 197 | 226 | 230 | 237 | 58 |
| 2002 | 120 | 119 | 159 | 193 | 177 | 161 | 200 | 250 | 169 | 168 | 121 | 165 |
| 2003 | -10 | 114 | 262 | 176 | 157 | 237 | 129 | 164 | 179 | 163 | 145 | 85 |
| 2004 | 94 | 58 | 145 | 210 | 178 | 171 | 174 | 190 | 125 | 91 | 163 | 117 |
| 2005 | 129 | 116 | 95 | 102 | 181 | 162 | 118 | 139 | 97 | 63 | 141 | 174 |
| 2006 | 197 | 114 | 175 | 170 | 254 | 144 | 6 | 92 | 107 | 48 | 81 | 109 |
| 2007 | 43 | 106 | 13 | 116 | 80 | 94 | 99 | -18 | -5 | 77 | 23 | -21 |
| 2008 | -90 | -28 | 27 | 140 | 20 | 90 | 1 | -38 | 26 | -31 | -70 | -49 |
| 2009 | -127 | -53 | -162 | -115 | -8 | 74 | 30 | 52 | 55 | 74 | 32 | 81 |
| 2010 | 46 | -89 | 115 | 96 | 73 | 117 | 136 | 152 | 177 | 157 | 86 | 154 |
| 2011 | -10 | 35 | 13 | 24 | 14 | 58 | 12 | 79 | 47 | 103 | 71 | 59 |
| 2012 | 20 | 100 | -67 | 21 | 122 | 19 | -11 | 77 | 25 | -21 | 14 | -23 |
| 2013 | -8 | 16 | -3 | -11 | 18 | 26 | -29 | 90 | 73 | 12 | 76 | -3 |
| 2014 | 13 | -26 | -27 | -18 | 58 | -19 | -5 | 14 | 10 | 53 | -34 | 2 |
| 2015 | -25 | -3 | -34 | -4 | 28 | -22 | 14 | 5 | 11 | 18 | 60 | 15 |
| 2016 | 38 | 4 | 41 | -26 | 79 | 28 | 63 | -8 | 84 | 65 | 98 | 87 |
| 2017 | 0 | 91 | 28 | 26 | 38 | 22 | 40 | 7 | 96 | 100 | 50 | 100 |
| 2018 | 58 | 37 | 91 | 31 | -2 | 69 | 74 | 24 | 72 | -9 | 36 | 50 |
| 2019 | 32 | 27 | 35 | 48 | 48 | 55 | 8 | 20 | 13 | 50 | 87 | 20 |
| 2020 | 32 | -9 | 3 | 36 | -26 | 3 | 24 | -1 | -9 | -3 | -18 | -30 |
| 2021 | -12 | 2 | 2 | -9 | 10 | 19 | -5 | -11 | 3 | 7 | 5 | -20 |
| 2022 | 28 | -19 | 4 | -17 | -11 | -39 | 43 | 5 | 5 | 1 | -9 | 7 |
| 2023 | 4 | 66 | 67 | 1 | 11 | -10 | -12 | 20 | 6 | 24 | 57 | 4 |
| 2024 | 22 | |||||||||||
| - = No Data Reported; -- = Not Applicable; NA = Not Available; W = Withheld to avoid disclosure of individual company data. |
| Release Date: 3/29/2024 |
| Next Release Date: 4/30/2024 |