|
Download Data (XLS File) |
|
||||||||
|
||||||||
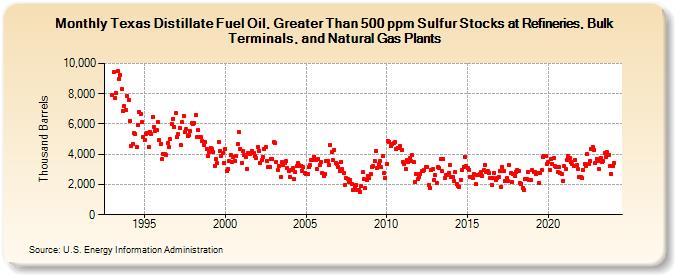
| Texas Distillate Fuel Oil, Greater Than 500 ppm Sulfur Stocks at Refineries, Bulk Terminals, and Natural Gas Plants (Thousand Barrels) | ||||||||
| Year | Jan | Feb | Mar | Apr | May | Jun | Jul | Aug | Sep | Oct | Nov | Dec |
|---|---|---|---|---|---|---|---|---|---|---|---|---|
| 1993 | 7,908 | 9,446 | 7,722 | 8,063 | 9,472 | 8,975 | 9,214 | 8,319 | 6,845 | 7,192 | 6,894 | 7,824 |
| 1994 | 7,600 | 6,192 | 4,575 | 4,693 | 5,393 | 5,328 | 4,451 | 5,933 | 6,768 | 6,681 | 6,144 | 5,156 |
| 1995 | 4,952 | 5,362 | 5,434 | 4,483 | 5,476 | 5,334 | 6,458 | 5,812 | 5,553 | 5,599 | 6,130 | 4,933 |
| 1996 | 4,682 | 3,682 | 4,029 | 4,017 | 3,958 | 4,739 | 4,459 | 4,985 | 6,004 | 6,355 | 5,805 | 6,727 |
| 1997 | 5,145 | 5,318 | 5,754 | 4,611 | 6,113 | 6,542 | 5,447 | 5,641 | 5,192 | 5,254 | 5,517 | 6,076 |
| 1998 | 5,994 | 6,071 | 6,609 | 5,108 | 5,615 | 5,116 | 5,115 | 4,880 | 4,631 | 4,825 | 4,368 | 3,865 |
| 1999 | 4,154 | 4,437 | 4,356 | 4,127 | 3,251 | 3,654 | 3,401 | 4,791 | 4,196 | 3,877 | 4,067 | 3,448 |
| 2000 | 4,362 | 2,862 | 3,017 | 3,527 | 3,933 | 3,492 | 3,817 | 3,572 | 3,861 | 4,646 | 5,448 | 4,361 |
| 2001 | 3,442 | 4,226 | 3,933 | 3,840 | 3,040 | 4,084 | 4,021 | 4,057 | 4,219 | 4,051 | 3,912 | 3,735 |
| 2002 | 4,446 | 4,244 | 3,394 | 3,647 | 3,794 | 4,317 | 4,483 | 3,579 | 3,129 | 3,183 | 3,691 | 3,685 |
| 2003 | 4,793 | 4,770 | 3,478 | 2,937 | 3,225 | 2,514 | 3,456 | 3,270 | 3,398 | 3,527 | 3,058 | 2,865 |
| 2004 | 2,517 | 2,980 | 3,073 | 2,356 | 2,840 | 3,189 | 3,392 | 3,255 | 3,245 | 2,915 | 3,122 | 2,782 |
| 2005 | 2,696 | 2,688 | 3,184 | 3,259 | 3,626 | 3,627 | 3,831 | 3,629 | 3,010 | 3,671 | 3,260 | 3,475 |
| 2006 | 2,754 | 2,561 | 2,691 | 3,584 | 3,583 | 3,317 | 4,606 | 4,164 | 3,590 | 4,294 | 3,423 | 3,386 |
| 2007 | 3,140 | 2,900 | 3,509 | 3,011 | 2,726 | 1,954 | 2,409 | 2,368 | 2,170 | 2,292 | 2,019 | 1,619 |
| 2008 | 1,819 | 1,982 | 1,661 | 1,649 | 1,530 | 1,899 | 2,805 | 2,334 | 1,759 | 2,315 | 2,567 | 2,422 |
| 2009 | 2,695 | 3,187 | 3,219 | 3,584 | 4,187 | 3,095 | 3,321 | 3,562 | 3,141 | 3,870 | 2,776 | 2,427 |
| 2010 | 3,372 | 4,889 | 4,831 | 4,554 | 4,682 | 4,729 | 4,805 | 4,344 | 4,437 | 4,383 | 4,553 | 4,267 |
| 2011 | 3,479 | 3,366 | 3,043 | 3,603 | 3,454 | 3,718 | 3,533 | 3,927 | 3,482 | 2,173 | 2,712 | 2,355 |
| 2012 | 2,513 | 2,723 | 2,874 | 2,897 | 2,973 | 3,154 | 3,171 | 1,967 | 1,741 | 2,956 | 3,005 | 2,322 |
| 2013 | 2,627 | 2,096 | 3,162 | 3,085 | 3,671 | 2,876 | 3,681 | 2,399 | 2,650 | 2,637 | 2,732 | 3,290 |
| 2014 | 2,520 | 2,511 | 2,226 | 2,842 | 2,022 | 1,866 | 1,849 | 2,324 | 2,954 | 3,167 | 3,822 | 3,191 |
| 2015 | 3,100 | 2,982 | 2,510 | 2,512 | 2,446 | 2,696 | 2,013 | 2,648 | 2,602 | 2,704 | 2,806 | 2,567 |
| 2016 | 2,949 | 3,291 | 2,853 | 2,891 | 2,761 | 2,412 | 1,995 | 2,460 | 2,761 | 2,298 | 2,439 | 2,517 |
| 2017 | 2,912 | 1,853 | 3,166 | 2,873 | 2,240 | 2,420 | 2,227 | 3,276 | 2,726 | 2,182 | 2,694 | 2,569 |
| 2018 | 2,855 | 2,976 | 2,906 | 2,112 | 2,053 | 1,750 | 1,653 | 2,376 | 2,377 | 2,841 | 2,315 | 2,310 |
| 2019 | 2,952 | 2,797 | 2,806 | 2,664 | 2,778 | 2,102 | 2,734 | 2,952 | 3,813 | 3,902 | 3,869 | 3,359 |
| 2020 | 3,516 | 2,960 | 3,655 | 3,368 | 3,728 | 3,200 | 3,122 | 2,802 | 3,138 | 2,750 | 2,705 | 2,241 |
| 2021 | 3,204 | 3,025 | 3,650 | 3,909 | 3,765 | 3,504 | 3,346 | 3,194 | 3,639 | 3,287 | 3,017 | 2,523 |
| 2022 | 2,470 | 2,411 | 2,967 | 3,343 | 3,198 | 3,989 | 3,361 | 3,532 | 4,375 | 4,469 | 4,268 | 3,404 |
| 2023 | 3,705 | 3,539 | 2,993 | 3,776 | 3,487 | 3,553 | 4,069 | 3,822 | 4,128 | 3,933 | 3,195 | 2,705 |
| 2024 | 3,253 | |||||||||||
| - = No Data Reported; -- = Not Applicable; NA = Not Available; W = Withheld to avoid disclosure of individual company data. |
| Release Date: 3/29/2024 |
| Next Release Date: 4/30/2024 |