|
Download Data (XLS File) |
|
||||||||
|
||||||||
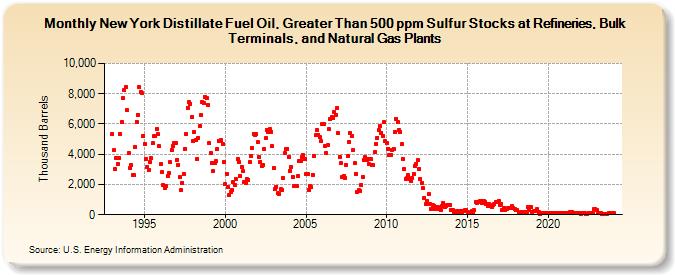
| New York Distillate Fuel Oil, Greater Than 500 ppm Sulfur Stocks at Refineries, Bulk Terminals, and Natural Gas Plants (Thousand Barrels) | ||||||||
| Year | Jan | Feb | Mar | Apr | May | Jun | Jul | Aug | Sep | Oct | Nov | Dec |
|---|---|---|---|---|---|---|---|---|---|---|---|---|
| 1993 | 5,341 | 4,253 | 2,998 | 3,726 | 3,371 | 3,766 | 5,327 | 6,117 | 7,691 | 8,231 | 8,435 | 6,918 |
| 1994 | 4,081 | 3,091 | 3,279 | 2,628 | 2,595 | 4,480 | 6,158 | 6,625 | 8,425 | 8,144 | 8,039 | 5,223 |
| 1995 | 4,699 | 3,689 | 3,128 | 2,986 | 3,478 | 3,720 | 4,722 | 5,181 | 5,189 | 5,672 | 5,314 | 4,513 |
| 1996 | 3,328 | 2,806 | 1,950 | 1,782 | 1,924 | 2,557 | 2,766 | 3,466 | 4,282 | 4,557 | 4,726 | 4,716 |
| 1997 | 3,643 | 3,274 | 2,464 | 1,629 | 2,097 | 2,718 | 4,356 | 5,347 | 7,085 | 7,423 | 7,343 | 6,454 |
| 1998 | 4,901 | 5,475 | 4,954 | 3,678 | 5,098 | 5,862 | 6,567 | 7,444 | 7,391 | 7,767 | 7,691 | 7,283 |
| 1999 | 4,722 | 4,070 | 3,426 | 2,871 | 3,407 | 3,523 | 4,341 | 4,891 | 4,889 | 4,916 | 4,686 | 3,476 |
| 2000 | 2,012 | 2,697 | 1,816 | 1,331 | 1,472 | 1,635 | 2,163 | 1,993 | 2,342 | 3,652 | 3,484 | 2,577 |
| 2001 | 3,158 | 2,862 | 2,194 | 2,130 | 2,352 | 2,305 | 3,471 | 3,885 | 4,395 | 5,349 | 5,238 | 5,330 |
| 2002 | 4,792 | 3,797 | 3,510 | 3,194 | 3,263 | 4,335 | 5,055 | 5,601 | 5,487 | 5,653 | 5,502 | 4,527 |
| 2003 | 3,118 | 1,679 | 1,842 | 1,405 | 1,387 | 1,677 | 1,640 | 2,428 | 4,065 | 4,315 | 4,370 | 3,837 |
| 2004 | 2,912 | 3,152 | 2,496 | 1,916 | 1,918 | 1,877 | 2,568 | 3,524 | 3,542 | 3,794 | 3,947 | 3,662 |
| 2005 | 2,664 | 2,713 | 1,653 | 1,920 | 1,810 | 2,656 | 3,891 | 5,249 | 5,607 | 5,292 | 5,135 | 4,851 |
| 2006 | 6,021 | 5,969 | 4,556 | 4,071 | 4,582 | 5,637 | 6,322 | 6,455 | 6,395 | 6,790 | 6,612 | 7,048 |
| 2007 | 5,399 | 3,839 | 3,389 | 2,525 | 2,563 | 2,430 | 3,302 | 3,885 | 4,835 | 5,383 | 5,198 | 4,277 |
| 2008 | 3,391 | 2,716 | 1,533 | 1,612 | 1,574 | 1,976 | 2,502 | 3,632 | 3,793 | 3,594 | 3,714 | 3,328 |
| 2009 | 3,653 | 3,306 | 3,256 | 4,139 | 4,666 | 5,100 | 5,586 | 5,858 | 5,410 | 5,214 | 6,100 | 4,853 |
| 2010 | 4,749 | 4,357 | 3,936 | 3,981 | 4,258 | 4,377 | 5,499 | 6,353 | 6,137 | 5,597 | 5,479 | 4,649 |
| 2011 | 3,698 | 2,992 | 2,372 | 2,427 | 2,600 | 2,362 | 2,240 | 2,447 | 2,697 | 3,246 | 3,382 | 3,606 |
| 2012 | 3,033 | 2,355 | 2,105 | 1,734 | 1,093 | 716 | 898 | 1,342 | 722 | 408 | 650 | 599 |
| 2013 | 384 | 495 | 486 | 362 | 319 | 577 | 796 | 513 | 602 | 654 | 665 | 625 |
| 2014 | 314 | 279 | 166 | 131 | 221 | 200 | 248 | 257 | 208 | 250 | 282 | 279 |
| 2015 | 197 | 121 | 114 | 237 | 170 | 279 | 857 | 791 | 862 | 877 | 926 | 791 |
| 2016 | 902 | 836 | 704 | 576 | 699 | 577 | 508 | 657 | 728 | 863 | 818 | 908 |
| 2017 | 669 | 699 | 280 | 454 | 322 | 383 | 442 | 445 | 443 | 559 | 446 | 388 |
| 2018 | 308 | 308 | 141 | 136 | 155 | 135 | 166 | 143 | 164 | 510 | 334 | 502 |
| 2019 | 195 | 217 | 238 | 224 | 358 | 177 | 79 | 92 | 119 | 106 | 86 | 102 |
| 2020 | 102 | 83 | 106 | 111 | 122 | 111 | 100 | 93 | 103 | 90 | 108 | 110 |
| 2021 | 127 | 104 | 109 | 121 | 151 | 139 | 180 | 141 | 122 | 138 | 131 | 99 |
| 2022 | 80 | 110 | 107 | 89 | 64 | 78 | 96 | 87 | 91 | 113 | 366 | 351 |
| 2023 | 291 | 131 | 101 | 101 | 79 | 71 | 62 | 64 | 70 | 109 | 138 | 109 |
| 2024 | 99 | |||||||||||
| - = No Data Reported; -- = Not Applicable; NA = Not Available; W = Withheld to avoid disclosure of individual company data. |
| Release Date: 3/29/2024 |
| Next Release Date: 4/30/2024 |