|
Download Data (XLS File) |
|
||||||||
|
||||||||
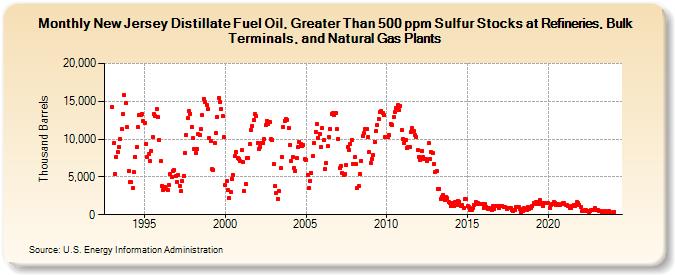
| New Jersey Distillate Fuel Oil, Greater Than 500 ppm Sulfur Stocks at Refineries, Bulk Terminals, and Natural Gas Plants (Thousand Barrels) | ||||||||
| Year | Jan | Feb | Mar | Apr | May | Jun | Jul | Aug | Sep | Oct | Nov | Dec |
|---|---|---|---|---|---|---|---|---|---|---|---|---|
| 1993 | 14,229 | 9,481 | 5,399 | 7,685 | 8,232 | 8,967 | 10,036 | 11,303 | 13,284 | 15,790 | 14,749 | 11,552 |
| 1994 | 5,763 | 4,285 | 4,268 | 3,589 | 5,587 | 7,687 | 8,916 | 11,564 | 13,252 | 13,160 | 13,351 | 12,352 |
| 1995 | 12,109 | 9,402 | 7,670 | 8,059 | 7,088 | 8,464 | 10,230 | 13,310 | 13,000 | 13,984 | 12,885 | 9,911 |
| 1996 | 7,039 | 3,828 | 3,230 | 3,695 | 3,347 | 3,217 | 3,956 | 5,322 | 4,994 | 5,813 | 5,889 | 5,065 |
| 1997 | 4,372 | 5,222 | 3,850 | 3,096 | 4,405 | 5,121 | 8,203 | 10,561 | 12,780 | 13,652 | 13,372 | 11,548 |
| 1998 | 10,123 | 8,756 | 8,171 | 8,720 | 10,618 | 10,542 | 11,289 | 13,150 | 15,365 | 14,863 | 14,497 | 13,945 |
| 1999 | 10,084 | 9,707 | 6,010 | 5,963 | 9,471 | 10,813 | 12,947 | 15,427 | 14,961 | 14,005 | 13,025 | 10,309 |
| 2000 | 3,880 | 4,449 | 3,253 | 2,219 | 3,016 | 4,661 | 5,211 | 7,774 | 8,315 | 7,528 | 7,414 | 7,091 |
| 2001 | 8,532 | 7,000 | 3,071 | 4,112 | 7,441 | 7,542 | 9,314 | 11,160 | 11,711 | 12,540 | 13,312 | 12,998 |
| 2002 | 9,495 | 8,746 | 9,017 | 9,541 | 9,524 | 9,973 | 11,810 | 12,432 | 11,978 | 12,319 | 10,006 | 9,891 |
| 2003 | 6,707 | 3,844 | 2,886 | 2,077 | 3,120 | 6,113 | 7,602 | 11,665 | 12,427 | 12,624 | 12,584 | 11,511 |
| 2004 | 9,279 | 7,141 | 7,578 | 6,182 | 5,846 | 7,554 | 8,921 | 9,616 | 9,382 | 9,087 | 9,246 | 7,371 |
| 2005 | 7,293 | 5,191 | 3,553 | 4,490 | 5,518 | 7,717 | 9,481 | 10,981 | 11,942 | 10,194 | 10,740 | 8,936 |
| 2006 | 11,422 | 9,832 | 6,029 | 6,785 | 9,029 | 10,258 | 11,318 | 13,337 | 13,389 | 13,196 | 13,508 | 11,325 |
| 2007 | 10,040 | 6,168 | 6,506 | 5,484 | 5,220 | 5,387 | 6,634 | 8,974 | 8,558 | 9,392 | 9,882 | 6,747 |
| 2008 | 7,628 | 6,743 | 3,551 | 3,787 | 5,382 | 7,146 | 10,370 | 10,758 | 11,330 | 11,303 | 10,286 | 8,231 |
| 2009 | 6,797 | 7,389 | 7,862 | 9,640 | 11,053 | 11,814 | 12,638 | 13,523 | 13,660 | 13,488 | 13,129 | 10,273 |
| 2010 | 10,280 | 10,241 | 10,557 | 12,044 | 11,877 | 12,892 | 13,524 | 14,178 | 14,508 | 13,834 | 14,385 | 11,242 |
| 2011 | 9,989 | 9,462 | 9,931 | 8,781 | 8,991 | 8,969 | 10,937 | 11,416 | 11,019 | 10,481 | 10,267 | 8,590 |
| 2012 | 7,679 | 7,270 | 8,492 | 7,615 | 7,395 | 7,348 | 7,075 | 9,443 | 7,416 | 8,305 | 8,107 | 6,761 |
| 2013 | 5,638 | 5,762 | 3,355 | 3,460 | 2,127 | 2,405 | 2,662 | 1,936 | 2,375 | 2,148 | 1,667 | 1,541 |
| 2014 | 1,214 | 1,497 | 1,174 | 1,616 | 1,334 | 1,853 | 1,740 | 1,157 | 1,265 | 825 | 2,065 | 2,080 |
| 2015 | 1,119 | 986 | 667 | 604 | 910 | 1,322 | 1,691 | 1,471 | 1,515 | 1,431 | 1,363 | 1,448 |
| 2016 | 894 | 1,414 | 1,070 | 813 | 825 | 695 | 670 | 1,110 | 768 | 1,105 | 1,171 | 875 |
| 2017 | 1,211 | 1,158 | 1,130 | 1,080 | 1,003 | 800 | 858 | 945 | 842 | 625 | 533 | 594 |
| 2018 | 973 | 1,054 | 1,038 | 759 | 356 | 493 | 854 | 758 | 662 | 995 | 804 | 907 |
| 2019 | 1,149 | 1,497 | 1,385 | 1,663 | 1,740 | 1,381 | 1,929 | 1,514 | 1,183 | 1,566 | 1,519 | 1,568 |
| 2020 | 1,544 | 914 | 1,284 | 1,436 | 1,658 | 1,553 | 1,237 | 1,388 | 1,299 | 1,310 | 1,451 | 1,509 |
| 2021 | 1,497 | 1,312 | 1,245 | 1,143 | 899 | 908 | 1,201 | 1,264 | 1,157 | 1,641 | 1,530 | 1,318 |
| 2022 | 1,067 | 460 | 510 | 568 | 579 | 458 | 406 | 501 | 560 | 569 | 572 | 825 |
| 2023 | 663 | 640 | 532 | 497 | 348 | 420 | 426 | 409 | 292 | 508 | 243 | 192 |
| 2024 | 322 | |||||||||||
| - = No Data Reported; -- = Not Applicable; NA = Not Available; W = Withheld to avoid disclosure of individual company data. |
| Release Date: 3/29/2024 |
| Next Release Date: 4/30/2024 |