|
Download Data (XLS File) |
|
||||||||
|
||||||||
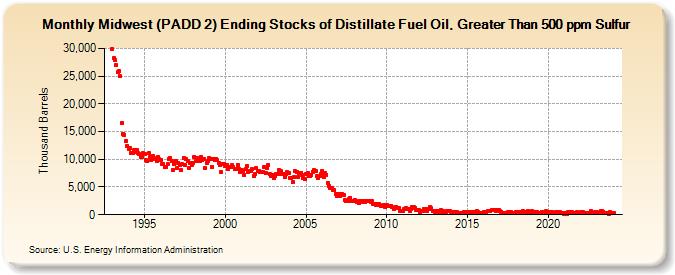
| Midwest (PADD 2) Ending Stocks of Distillate Fuel Oil, Greater Than 500 ppm Sulfur (Thousand Barrels) | ||||||||
| Year | Jan | Feb | Mar | Apr | May | Jun | Jul | Aug | Sep | Oct | Nov | Dec |
|---|---|---|---|---|---|---|---|---|---|---|---|---|
| 1993 | 29,913 | 28,181 | 27,860 | 26,919 | 25,703 | 25,854 | 25,024 | 16,576 | 14,597 | 14,425 | 13,264 | 12,481 |
| 1994 | 11,926 | 11,987 | 11,120 | 11,202 | 11,598 | 11,243 | 11,703 | 11,097 | 10,972 | 10,424 | 10,327 | 11,045 |
| 1995 | 10,991 | 9,790 | 9,665 | 11,053 | 10,437 | 9,809 | 10,655 | 10,166 | 10,091 | 9,670 | 10,441 | 9,988 |
| 1996 | 9,834 | 9,060 | 9,064 | 8,543 | 8,538 | 9,095 | 10,039 | 10,190 | 9,707 | 8,080 | 9,166 | 9,695 |
| 1997 | 8,467 | 9,392 | 8,989 | 7,976 | 9,077 | 10,239 | 8,940 | 9,987 | 9,656 | 8,487 | 9,360 | 8,996 |
| 1998 | 9,388 | 10,473 | 9,687 | 10,252 | 9,813 | 9,684 | 10,423 | 9,839 | 10,137 | 8,349 | 9,324 | 9,720 |
| 1999 | 10,195 | 10,027 | 8,642 | 10,016 | 9,785 | 10,029 | 9,813 | 9,373 | 8,917 | 7,656 | 9,148 | 9,217 |
| 2000 | 8,786 | 9,017 | 8,272 | 8,640 | 8,552 | 8,884 | 8,623 | 8,197 | 8,237 | 9,046 | 8,250 | 7,618 |
| 2001 | 8,032 | 7,851 | 7,221 | 8,245 | 8,754 | 7,764 | 7,918 | 7,811 | 8,178 | 7,050 | 7,315 | 8,421 |
| 2002 | 7,933 | 7,957 | 7,761 | 7,768 | 7,775 | 8,561 | 7,455 | 8,373 | 9,055 | 7,357 | 6,952 | 7,250 |
| 2003 | 6,678 | 6,998 | 7,399 | 7,343 | 8,065 | 7,845 | 7,259 | 7,377 | 6,747 | 7,342 | 7,682 | 7,563 |
| 2004 | 6,699 | 6,702 | 5,844 | 6,736 | 7,832 | 7,758 | 6,856 | 7,524 | 7,582 | 7,202 | 6,629 | 6,390 |
| 2005 | 7,421 | 7,520 | 6,914 | 6,955 | 7,225 | 7,785 | 8,103 | 7,854 | 7,067 | 6,636 | 7,019 | 7,318 |
| 2006 | 7,972 | 6,847 | 7,474 | 7,245 | 5,794 | 5,229 | 4,904 | 4,810 | 4,412 | 4,376 | 3,742 | 3,446 |
| 2007 | 3,698 | 3,421 | 3,795 | 3,766 | 3,592 | 2,687 | 2,447 | 2,457 | 2,799 | 3,081 | 2,483 | 2,392 |
| 2008 | 2,699 | 2,562 | 2,228 | 2,184 | 2,551 | 2,423 | 2,378 | 2,512 | 2,268 | 2,384 | 2,533 | 2,458 |
| 2009 | 2,365 | 2,386 | 1,871 | 1,986 | 1,750 | 1,969 | 1,850 | 1,736 | 1,653 | 1,581 | 1,824 | 1,302 |
| 2010 | 1,673 | 1,525 | 1,587 | 1,642 | 1,337 | 1,101 | 1,169 | 1,396 | 1,289 | 1,157 | 675 | 740 |
| 2011 | 734 | 1,101 | 1,167 | 954 | 1,037 | 709 | 1,043 | 1,398 | 1,314 | 1,268 | 770 | 916 |
| 2012 | 806 | 520 | 702 | 730 | 950 | 949 | 733 | 1,046 | 1,383 | 1,124 | 662 | 730 |
| 2013 | 545 | 599 | 520 | 598 | 838 | 568 | 651 | 530 | 550 | 692 | 665 | 608 |
| 2014 | 576 | 492 | 508 | 376 | 484 | 255 | 309 | 260 | 288 | 428 | 507 | 412 |
| 2015 | 463 | 336 | 414 | 435 | 522 | 432 | 478 | 620 | 534 | 381 | 318 | 371 |
| 2016 | 476 | 359 | 453 | 632 | 610 | 640 | 831 | 879 | 872 | 738 | 766 | 824 |
| 2017 | 647 | 560 | 389 | 329 | 370 | 347 | 471 | 439 | 559 | 389 | 354 | 339 |
| 2018 | 541 | 574 | 454 | 426 | 529 | 632 | 554 | 579 | 577 | 622 | 469 | 337 |
| 2019 | 622 | 441 | 478 | 499 | 482 | 385 | 384 | 491 | 456 | 451 | 587 | 514 |
| 2020 | 436 | 452 | 429 | 422 | 381 | 336 | 402 | 535 | 433 | 411 | 336 | 296 |
| 2021 | 185 | 377 | 198 | 455 | 462 | 460 | 468 | 280 | 314 | 401 | 396 | 355 |
| 2022 | 400 | 324 | 427 | 252 | 283 | 249 | 337 | 242 | 618 | 247 | 318 | 405 |
| 2023 | 420 | 319 | 286 | 705 | 628 | 559 | 381 | 329 | 351 | 210 | 454 | 337 |
| 2024 | 334 | |||||||||||
| - = No Data Reported; -- = Not Applicable; NA = Not Available; W = Withheld to avoid disclosure of individual company data. |
| Release Date: 3/29/2024 |
| Next Release Date: 4/30/2024 |