|
Download Data (XLS File) |
|
||||||||
|
||||||||
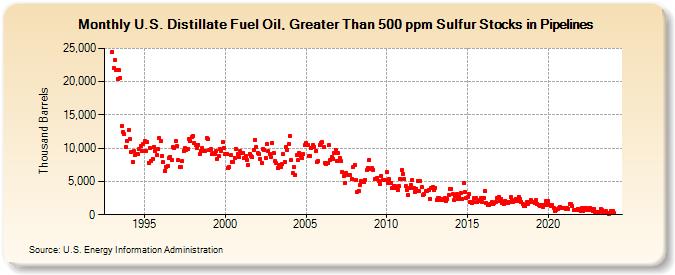
| U.S. Distillate Fuel Oil, Greater Than 500 ppm Sulfur Stocks in Pipelines (Thousand Barrels) | ||||||||
| Year | Jan | Feb | Mar | Apr | May | Jun | Jul | Aug | Sep | Oct | Nov | Dec |
|---|---|---|---|---|---|---|---|---|---|---|---|---|
| 1993 | 24,495 | 22,017 | 23,310 | 21,765 | 20,343 | 21,706 | 20,572 | 13,386 | 12,413 | 12,062 | 10,199 | 11,140 |
| 1994 | 12,731 | 11,349 | 9,450 | 7,975 | 9,505 | 8,917 | 9,112 | 9,117 | 9,838 | 10,394 | 9,622 | 10,657 |
| 1995 | 11,049 | 9,638 | 10,881 | 7,824 | 10,001 | 8,013 | 8,448 | 10,253 | 9,626 | 8,956 | 9,810 | 11,496 |
| 1996 | 11,006 | 8,890 | 7,861 | 6,613 | 7,202 | 7,264 | 8,492 | 8,676 | 8,241 | 10,103 | 10,055 | 11,016 |
| 1997 | 10,326 | 8,209 | 7,236 | 7,154 | 8,071 | 9,589 | 9,987 | 9,745 | 9,880 | 11,402 | 11,050 | 11,723 |
| 1998 | 11,869 | 10,836 | 10,502 | 10,029 | 10,542 | 9,120 | 9,631 | 10,022 | 9,611 | 9,564 | 11,582 | 11,361 |
| 1999 | 9,694 | 9,838 | 9,086 | 9,287 | 9,076 | 9,514 | 8,434 | 8,852 | 9,935 | 9,590 | 10,857 | 10,026 |
| 2000 | 9,060 | 9,063 | 6,980 | 7,109 | 8,924 | 7,980 | 7,948 | 8,583 | 9,880 | 9,192 | 8,678 | 9,600 |
| 2001 | 9,245 | 9,261 | 8,475 | 8,893 | 8,234 | 7,404 | 9,145 | 8,849 | 8,636 | 9,751 | 11,251 | 10,216 |
| 2002 | 9,216 | 9,142 | 8,372 | 7,833 | 9,894 | 9,750 | 8,590 | 10,612 | 9,558 | 9,169 | 8,665 | 10,790 |
| 2003 | 9,288 | 8,029 | 7,737 | 6,989 | 7,424 | 7,238 | 7,615 | 9,074 | 7,980 | 10,240 | 9,792 | 10,575 |
| 2004 | 11,834 | 8,259 | 6,295 | 7,170 | 6,006 | 8,919 | 8,175 | 9,338 | 8,775 | 8,525 | 9,108 | 10,448 |
| 2005 | 10,829 | 10,466 | 8,856 | 8,854 | 10,095 | 10,488 | 10,106 | 9,558 | 7,947 | 8,031 | 10,452 | 10,737 |
| 2006 | 10,909 | 10,244 | 7,770 | 7,611 | 7,836 | 10,464 | 8,189 | 8,696 | 8,421 | 9,335 | 9,743 | 8,137 |
| 2007 | 9,253 | 8,596 | 8,015 | 6,457 | 5,758 | 4,803 | 6,299 | 5,989 | 5,993 | 5,968 | 5,401 | 7,103 |
| 2008 | 7,533 | 5,253 | 3,403 | 3,623 | 4,429 | 5,093 | 4,844 | 4,849 | 5,152 | 6,668 | 7,067 | 8,228 |
| 2009 | 6,904 | 7,005 | 6,736 | 5,375 | 5,442 | 5,579 | 5,068 | 4,553 | 5,871 | 5,183 | 5,197 | 5,194 |
| 2010 | 6,449 | 4,806 | 5,301 | 4,841 | 3,960 | 4,312 | 4,250 | 4,047 | 3,694 | 4,278 | 5,437 | 6,755 |
| 2011 | 6,188 | 5,300 | 4,341 | 3,717 | 2,911 | 4,033 | 4,535 | 5,244 | 4,023 | 3,410 | 3,936 | 5,069 |
| 2012 | 3,505 | 5,037 | 4,123 | 2,943 | 3,117 | 3,569 | 3,558 | 3,742 | 2,369 | 3,959 | 4,132 | 3,746 |
| 2013 | 4,026 | 2,286 | 2,577 | 2,539 | 2,210 | 2,172 | 2,346 | 2,453 | 2,045 | 2,354 | 2,939 | 3,894 |
| 2014 | 3,920 | 3,055 | 2,146 | 2,870 | 3,050 | 2,345 | 2,690 | 3,247 | 2,349 | 4,761 | 3,391 | 2,499 |
| 2015 | 2,588 | 3,056 | 1,912 | 1,709 | 1,954 | 2,508 | 2,545 | 1,876 | 2,031 | 2,150 | 2,497 | 1,913 |
| 2016 | 2,455 | 3,586 | 1,779 | 1,489 | 1,527 | 1,554 | 1,875 | 1,538 | 1,687 | 1,879 | 2,543 | 2,731 |
| 2017 | 2,000 | 2,436 | 1,765 | 1,600 | 2,067 | 1,857 | 1,753 | 1,892 | 2,682 | 2,170 | 1,885 | 2,057 |
| 2018 | 2,331 | 1,995 | 2,724 | 2,287 | 1,953 | 1,554 | 1,300 | 1,290 | 1,879 | 1,664 | 1,862 | 2,166 |
| 2019 | 1,902 | 1,909 | 1,727 | 2,173 | 1,646 | 1,413 | 1,368 | 1,400 | 1,211 | 1,410 | 2,011 | 1,518 |
| 2020 | 2,032 | 1,532 | 1,382 | 1,412 | 1,016 | 554 | 780 | 817 | 960 | 1,223 | 1,054 | 983 |
| 2021 | 988 | 830 | 984 | 862 | 1,649 | 1,596 | 1,290 | 640 | 745 | 701 | 905 | 675 |
| 2022 | 501 | 953 | 624 | 1,015 | 1,007 | 722 | 774 | 1,065 | 899 | 488 | 854 | 461 |
| 2023 | 200 | 346 | 435 | 917 | 648 | 435 | 326 | 519 | 280 | 151 | 274 | 583 |
| 2024 | 516 | |||||||||||
| - = No Data Reported; -- = Not Applicable; NA = Not Available; W = Withheld to avoid disclosure of individual company data. |
| Release Date: 3/29/2024 |
| Next Release Date: 4/30/2024 |