|
Download Data (XLS File) |
|
||||||||
|
||||||||
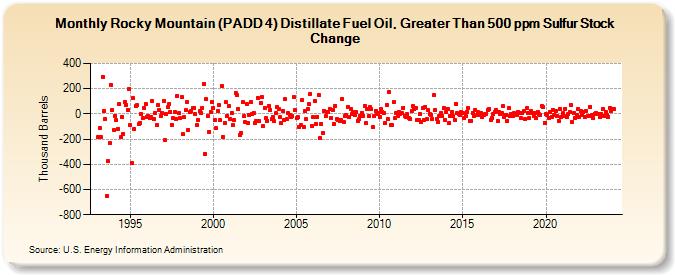
| Rocky Mountain (PADD 4) Distillate Fuel Oil, Greater Than 500 ppm Sulfur Stock Change (Thousand Barrels) | ||||||||
| Year | Jan | Feb | Mar | Apr | May | Jun | Jul | Aug | Sep | Oct | Nov | Dec |
|---|---|---|---|---|---|---|---|---|---|---|---|---|
| 1993 | -181 | -114 | -187 | 295 | 22 | -41 | -649 | -374 | -233 | 231 | 31 | |
| 1994 | -128 | -15 | -51 | -117 | 78 | -187 | -22 | -158 | 96 | 74 | 33 | 201 |
| 1995 | -90 | -393 | 126 | -121 | 59 | 67 | -84 | -70 | 2 | -33 | 49 | 80 |
| 1996 | -26 | -14 | -36 | -21 | 100 | -39 | 6 | -87 | 69 | 34 | -19 | 9 |
| 1997 | 102 | -210 | 0 | 54 | 79 | 17 | -86 | -36 | 14 | -38 | 144 | 5 |
| 1998 | -31 | 134 | -162 | -23 | 27 | 92 | -126 | 12 | 22 | 45 | 49 | -4 |
| 1999 | -89 | -48 | 19 | 10 | 46 | 241 | -316 | 118 | -13 | -141 | 12 | 94 |
| 2000 | 49 | -49 | -115 | 20 | 67 | -49 | 222 | -182 | -72 | 92 | -13 | 63 |
| 2001 | -41 | 9 | -90 | -52 | 168 | 149 | 36 | -171 | -149 | 93 | -18 | -67 |
| 2002 | 80 | -71 | -5 | 93 | 2 | 11 | -73 | -56 | 130 | -60 | 87 | 135 |
| 2003 | -98 | 48 | -34 | -53 | 62 | 32 | -44 | -24 | -59 | 5 | 52 | 35 |
| 2004 | -28 | -73 | 23 | -45 | 117 | -41 | 6 | -9 | -27 | -16 | 135 | 27 |
| 2005 | -36 | -27 | -102 | -91 | 109 | -102 | 23 | -41 | 37 | 77 | 160 | -94 |
| 2006 | -25 | 101 | -78 | -24 | 149 | -194 | -77 | -149 | 26 | -19 | 16 | 16 |
| 2007 | 37 | -30 | 30 | -78 | 66 | -44 | -47 | -55 | -49 | 120 | -64 | -18 |
| 2008 | -8 | 55 | -23 | 42 | 2 | 13 | -11 | 12 | -53 | -43 | -16 | 11 |
| 2009 | -17 | 64 | -72 | 36 | -20 | 56 | 36 | -107 | -19 | 23 | 0 | 11 |
| 2010 | -27 | 37 | 17 | 7 | -69 | 74 | -43 | 176 | -90 | -89 | 95 | -33 |
| 2011 | 5 | -15 | 18 | 0 | 6 | 50 | -16 | -28 | -4 | -29 | -42 | 20 |
| 2012 | 59 | 36 | 43 | -46 | -52 | -4 | -64 | 47 | -49 | 53 | -43 | 28 |
| 2013 | 3 | -7 | -40 | 146 | 31 | -39 | -65 | -16 | 7 | -14 | 45 | -45 |
| 2014 | 18 | 38 | -75 | -19 | 17 | -20 | -46 | 81 | 4 | 2 | -7 | 13 |
| 2015 | 6 | -35 | -16 | 17 | 44 | -53 | -53 | 10 | -13 | 28 | -9 | 13 |
| 2016 | -7 | 8 | -24 | -7 | -4 | 2 | 28 | 39 | -47 | -30 | -2 | 12 |
| 2017 | 32 | -54 | 16 | -2 | 11 | 60 | -23 | -6 | -54 | 50 | -19 | 1 |
| 2018 | -17 | 5 | 3 | -5 | 18 | 8 | -33 | 8 | 21 | -41 | 44 | 9 |
| 2019 | -34 | 21 | 8 | -18 | 5 | -35 | 16 | -2 | -6 | 63 | 52 | -69 |
| 2020 | -2 | -6 | -29 | 18 | -21 | 31 | -5 | 22 | -15 | -54 | 40 | -28 |
| 2021 | 4 | -15 | 41 | -27 | -2 | 15 | 72 | -66 | 8 | -30 | -8 | 36 |
| 2022 | -23 | 20 | -12 | 16 | -24 | 25 | -18 | -16 | 57 | -11 | -35 | 3 |
| 2023 | 11 | -2 | -4 | -26 | 0 | 40 | -19 | 15 | -7 | -21 | 47 | 22 |
| 2024 | 35 | |||||||||||
| - = No Data Reported; -- = Not Applicable; NA = Not Available; W = Withheld to avoid disclosure of individual company data. |
| Release Date: 3/29/2024 |
| Next Release Date: 4/30/2024 |