|
Download Data (XLS File) |
|
||||||||
|
||||||||
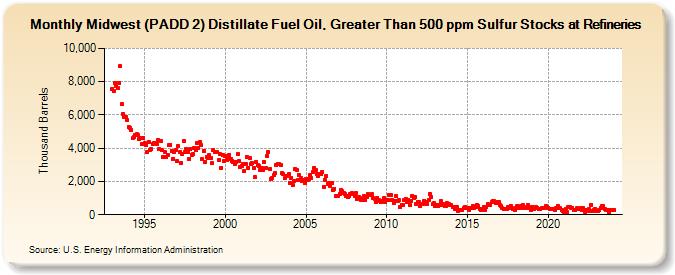
| Midwest (PADD 2) Distillate Fuel Oil, Greater Than 500 ppm Sulfur Stocks at Refineries (Thousand Barrels) | ||||||||
| Year | Jan | Feb | Mar | Apr | May | Jun | Jul | Aug | Sep | Oct | Nov | Dec |
|---|---|---|---|---|---|---|---|---|---|---|---|---|
| 1993 | 7,560 | 7,445 | 7,907 | 7,755 | 7,615 | 7,947 | 8,929 | 6,648 | 6,082 | 5,851 | 5,890 | 5,667 |
| 1994 | 5,263 | 5,228 | 5,107 | 4,589 | 4,647 | 4,808 | 4,833 | 4,781 | 4,548 | 4,638 | 4,227 | 4,638 |
| 1995 | 4,288 | 4,195 | 3,772 | 4,376 | 3,920 | 3,941 | 4,253 | 4,282 | 4,333 | 4,245 | 4,490 | 3,944 |
| 1996 | 4,419 | 3,866 | 3,494 | 3,743 | 3,475 | 3,573 | 4,190 | 4,221 | 3,823 | 3,372 | 3,778 | 3,862 |
| 1997 | 3,210 | 4,128 | 3,749 | 3,134 | 3,674 | 4,434 | 3,797 | 3,939 | 3,741 | 3,378 | 3,953 | 3,607 |
| 1998 | 3,642 | 4,015 | 3,867 | 4,323 | 4,016 | 4,350 | 4,177 | 3,322 | 3,848 | 3,189 | 3,477 | 3,399 |
| 1999 | 3,573 | 3,419 | 3,082 | 3,887 | 3,760 | 3,777 | 3,765 | 3,273 | 3,637 | 2,829 | 3,563 | 3,254 |
| 2000 | 3,536 | 3,307 | 3,376 | 3,613 | 3,356 | 3,247 | 3,155 | 3,079 | 3,158 | 3,647 | 3,224 | 2,862 |
| 2001 | 2,952 | 3,076 | 2,636 | 3,077 | 3,477 | 2,832 | 3,430 | 3,056 | 3,097 | 2,809 | 2,247 | 3,189 |
| 2002 | 2,969 | 2,947 | 2,688 | 2,836 | 2,667 | 3,159 | 2,804 | 3,511 | 3,769 | 2,735 | 2,137 | 2,219 |
| 2003 | 2,372 | 2,484 | 2,974 | 3,033 | 3,048 | 2,959 | 2,491 | 2,444 | 2,187 | 2,319 | 2,348 | 2,422 |
| 2004 | 1,933 | 2,223 | 1,771 | 2,057 | 2,750 | 2,683 | 2,093 | 2,361 | 2,235 | 2,036 | 2,058 | 1,931 |
| 2005 | 2,168 | 2,089 | 2,168 | 2,367 | 2,192 | 2,550 | 2,825 | 2,696 | 2,445 | 2,318 | 2,447 | 2,432 |
| 2006 | 2,584 | 1,682 | 2,117 | 2,321 | 1,873 | 1,933 | 1,742 | 1,926 | 1,464 | 1,568 | 1,113 | 1,115 |
| 2007 | 1,151 | 1,254 | 1,498 | 1,403 | 1,284 | 1,230 | 1,115 | 1,042 | 1,118 | 1,250 | 1,278 | 1,236 |
| 2008 | 1,131 | 1,297 | 943 | 1,047 | 1,011 | 883 | 880 | 1,129 | 866 | 1,083 | 1,259 | 1,163 |
| 2009 | 1,205 | 1,223 | 1,000 | 961 | 794 | 1,029 | 888 | 832 | 789 | 837 | 984 | 741 |
| 2010 | 855 | 889 | 1,173 | 1,177 | 901 | 718 | 798 | 1,110 | 801 | 883 | 489 | 599 |
| 2011 | 586 | 880 | 955 | 763 | 906 | 604 | 821 | 1,144 | 1,008 | 1,070 | 636 | 789 |
| 2012 | 750 | 500 | 656 | 668 | 825 | 741 | 663 | 870 | 1,237 | 1,091 | 631 | 700 |
| 2013 | 516 | 582 | 502 | 579 | 821 | 558 | 643 | 525 | 549 | 688 | 653 | 607 |
| 2014 | 572 | 483 | 490 | 371 | 481 | 248 | 302 | 259 | 262 | 387 | 441 | 378 |
| 2015 | 433 | 301 | 384 | 418 | 503 | 425 | 466 | 609 | 521 | 372 | 309 | 363 |
| 2016 | 460 | 295 | 443 | 625 | 594 | 607 | 746 | 826 | 809 | 714 | 754 | 748 |
| 2017 | 574 | 504 | 376 | 319 | 359 | 334 | 462 | 432 | 546 | 374 | 336 | 261 |
| 2018 | 408 | 524 | 439 | 402 | 508 | 608 | 420 | 394 | 451 | 584 | 418 | 300 |
| 2019 | 489 | 364 | 408 | 453 | 431 | 352 | 356 | 383 | 402 | 381 | 510 | 478 |
| 2020 | 404 | 358 | 341 | 365 | 342 | 311 | 375 | 510 | 405 | 378 | 310 | 233 |
| 2021 | 159 | 354 | 177 | 435 | 438 | 431 | 431 | 257 | 291 | 376 | 372 | 332 |
| 2022 | 377 | 304 | 400 | 180 | 263 | 229 | 319 | 226 | 601 | 229 | 301 | 359 |
| 2023 | 243 | 236 | 258 | 416 | 513 | 520 | 336 | 288 | 272 | 163 | 256 | 264 |
| 2024 | 298 | |||||||||||
| - = No Data Reported; -- = Not Applicable; NA = Not Available; W = Withheld to avoid disclosure of individual company data. |
| Release Date: 3/29/2024 |
| Next Release Date: 4/30/2024 |