|
Download Data (XLS File) |
|
||||||||
|
||||||||
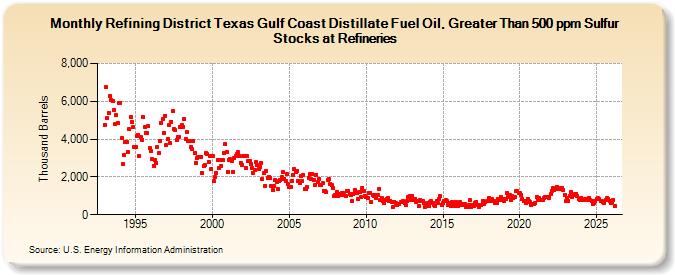
| Refining District Texas Gulf Coast Distillate Fuel Oil, Greater Than 500 ppm Sulfur Stocks at Refineries (Thousand Barrels) | ||||||||
| Year | Jan | Feb | Mar | Apr | May | Jun | Jul | Aug | Sep | Oct | Nov | Dec |
|---|---|---|---|---|---|---|---|---|---|---|---|---|
| 1993 | 4,759 | 6,730 | 5,126 | 5,403 | 6,278 | 6,077 | 6,021 | 5,550 | 4,796 | 5,265 | 4,868 | 5,894 |
| 1994 | 5,932 | 4,050 | 2,669 | 3,134 | 3,872 | 3,830 | 3,329 | 4,520 | 5,177 | 4,906 | 4,651 | 3,562 |
| 1995 | 3,586 | 4,148 | 4,191 | 3,124 | 4,090 | 3,975 | 5,152 | 4,636 | 4,340 | 4,340 | 4,679 | 3,507 |
| 1996 | 3,354 | 2,929 | 2,598 | 2,889 | 2,755 | 3,557 | 3,269 | 3,892 | 4,857 | 5,039 | 4,348 | 5,243 |
| 1997 | 3,705 | 4,011 | 4,748 | 3,802 | 4,926 | 5,467 | 4,521 | 4,457 | 3,971 | 4,114 | 4,120 | 4,646 |
| 1998 | 4,731 | 4,659 | 5,045 | 3,985 | 4,371 | 3,889 | 3,911 | 3,587 | 3,473 | 3,899 | 3,243 | 2,762 |
| 1999 | 2,996 | 3,054 | 3,034 | 3,068 | 2,205 | 2,566 | 2,605 | 3,268 | 3,192 | 2,802 | 3,094 | 2,397 |
| 2000 | 3,132 | 1,780 | 1,970 | 2,217 | 2,897 | 2,455 | 2,904 | 2,588 | 2,898 | 3,246 | 3,718 | 3,334 |
| 2001 | 2,278 | 2,893 | 2,925 | 2,856 | 2,280 | 3,021 | 3,097 | 3,223 | 3,296 | 3,116 | 2,750 | 2,610 |
| 2002 | 3,116 | 3,090 | 2,486 | 3,094 | 2,825 | 2,860 | 2,669 | 2,477 | 2,195 | 2,381 | 2,797 | 2,652 |
| 2003 | 2,400 | 2,518 | 2,754 | 1,893 | 2,192 | 1,520 | 2,316 | 1,950 | 1,999 | 1,966 | 1,493 | 1,316 |
| 2004 | 1,522 | 1,828 | 1,706 | 1,360 | 1,767 | 1,818 | 1,969 | 2,264 | 1,913 | 1,773 | 2,165 | 1,599 |
| 2005 | 1,459 | 1,491 | 1,809 | 2,086 | 2,417 | 2,282 | 2,332 | 1,783 | 1,665 | 2,039 | 1,778 | 2,118 |
| 2006 | 1,359 | 1,377 | 1,455 | 1,955 | 2,146 | 1,888 | 2,177 | 1,844 | 1,553 | 2,124 | 1,714 | 1,887 |
| 2007 | 1,577 | 1,591 | 1,657 | 1,262 | 1,253 | 1,179 | 1,822 | 1,873 | 1,612 | 1,570 | 1,433 | 978 |
| 2008 | 1,062 | 1,220 | 976 | 1,111 | 1,051 | 1,161 | 1,136 | 1,033 | 979 | 1,247 | 1,266 | 1,106 |
| 2009 | 1,043 | 715 | 1,074 | 1,295 | 1,204 | 1,165 | 840 | 1,195 | 913 | 1,432 | 1,272 | 991 |
| 2010 | 934 | 860 | 1,171 | 1,153 | 665 | 1,039 | 977 | 1,056 | 881 | 1,028 | 1,338 | 780 |
| 2011 | 898 | 706 | 595 | 757 | 838 | 879 | 732 | 745 | 695 | 416 | 690 | 624 |
| 2012 | 528 | 577 | 561 | 655 | 657 | 721 | 609 | 507 | 709 | 959 | 983 | 779 |
| 2013 | 1,008 | 752 | 823 | 675 | 731 | 443 | 753 | 707 | 745 | 613 | 419 | 580 |
| 2014 | 607 | 470 | 648 | 722 | 604 | 493 | 474 | 743 | 596 | 828 | 976 | 533 |
| 2015 | 631 | 713 | 752 | 720 | 494 | 626 | 454 | 664 | 539 | 455 | 681 | 500 |
| 2016 | 442 | 664 | 540 | 553 | 508 | 581 | 389 | 397 | 493 | 752 | 407 | 518 |
| 2017 | 487 | 612 | 681 | 531 | 434 | 516 | 509 | 731 | 570 | 647 | 712 | 731 |
| 2018 | 862 | 727 | 822 | 744 | 746 | 618 | 642 | 840 | 792 | 921 | 753 | 827 |
| 2019 | 745 | 830 | 1,154 | 942 | 1,047 | 795 | 978 | 890 | 940 | 1,230 | 1,232 | 1,150 |
| 2020 | 1,139 | 1,045 | 855 | 718 | 705 | 646 | 851 | 704 | 679 | 526 | 589 | 580 |
| 2021 | 634 | 960 | 796 | 877 | 753 | 786 | 804 | 868 | 936 | 947 | 929 | 898 |
| 2022 | 1,105 | 1,264 | 1,405 | 1,282 | 1,372 | 1,490 | 1,334 | 1,359 | 1,431 | 1,409 | 1,281 | 1,031 |
| 2023 | 870 | 1,028 | 897 | 1,056 | 1,359 | 1,133 | 1,215 | 1,252 | 1,299 | 1,187 | 1,090 | 802 |
| 2024 | 901 | |||||||||||
| - = No Data Reported; -- = Not Applicable; NA = Not Available; W = Withheld to avoid disclosure of individual company data. |
| Release Date: 3/29/2024 |
| Next Release Date: 4/30/2024 |