|
Download Data (XLS File) |
|
||||||||
|
||||||||
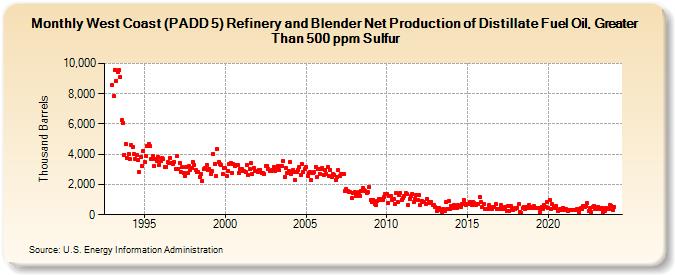
| West Coast (PADD 5) Refinery and Blender Net Production of Distillate Fuel Oil, Greater Than 500 ppm Sulfur (Thousand Barrels) | ||||||||
| Year | Jan | Feb | Mar | Apr | May | Jun | Jul | Aug | Sep | Oct | Nov | Dec |
|---|---|---|---|---|---|---|---|---|---|---|---|---|
| 1993 | 8,562 | 7,837 | 9,592 | 8,866 | 9,468 | 9,556 | 9,133 | 6,231 | 6,070 | 3,975 | 4,677 | 3,742 |
| 1994 | 4,045 | 3,657 | 4,611 | 4,467 | 4,027 | 3,679 | 3,934 | 3,593 | 2,841 | 3,836 | 3,233 | 4,210 |
| 1995 | 3,489 | 3,875 | 4,559 | 4,664 | 4,528 | 3,672 | 3,878 | 3,200 | 3,712 | 3,582 | 3,810 | 3,304 |
| 1996 | 3,557 | 3,766 | 3,690 | 3,134 | 3,187 | 3,472 | 3,442 | 3,763 | 3,414 | 3,351 | 3,495 | 3,004 |
| 1997 | 3,892 | 3,055 | 3,444 | 2,827 | 3,136 | 2,729 | 2,577 | 3,165 | 2,752 | 3,193 | 2,966 | 3,114 |
| 1998 | 3,482 | 3,288 | 2,981 | 2,813 | 2,828 | 2,502 | 2,684 | 2,202 | 3,011 | 3,109 | 3,316 | 2,959 |
| 1999 | 3,040 | 2,672 | 2,872 | 4,024 | 3,352 | 2,552 | 4,322 | 3,482 | 3,345 | 3,296 | 2,661 | 3,065 |
| 2000 | 3,071 | 2,591 | 2,900 | 3,356 | 3,426 | 2,790 | 3,328 | 3,205 | 3,285 | 3,260 | 2,761 | 3,050 |
| 2001 | 2,996 | 2,886 | 2,888 | 2,808 | 3,300 | 2,606 | 3,040 | 3,389 | 2,685 | 3,117 | 2,893 | 2,886 |
| 2002 | 2,855 | 2,968 | 2,977 | 2,782 | 2,774 | 2,697 | 3,236 | 3,210 | 3,049 | 2,894 | 2,861 | 2,947 |
| 2003 | 3,143 | 2,896 | 3,032 | 3,207 | 2,932 | 3,204 | 3,210 | 3,523 | 2,483 | 3,119 | 2,791 | 2,916 |
| 2004 | 3,498 | 2,684 | 2,934 | 2,812 | 2,286 | 2,826 | 2,980 | 3,138 | 2,646 | 3,371 | 2,799 | 2,997 |
| 2005 | 3,134 | 2,579 | 2,790 | 2,813 | 2,266 | 2,761 | 2,848 | 3,170 | 2,486 | 3,046 | 2,722 | 3,004 |
| 2006 | 3,107 | 2,629 | 2,958 | 2,693 | 3,138 | 2,564 | 2,985 | 2,499 | 2,670 | 2,654 | 2,263 | 2,483 |
| 2007 | 2,935 | 2,566 | 2,667 | 2,663 | 2,706 | 1,578 | 1,702 | 1,560 | 1,494 | 1,475 | 1,082 | 1,447 |
| 2008 | 1,514 | 1,249 | 1,442 | 1,479 | 1,251 | 1,539 | 1,787 | 1,609 | 1,570 | 1,447 | 1,477 | 1,813 |
| 2009 | 1,003 | 857 | 982 | 728 | 650 | 916 | 1,021 | 999 | 1,026 | 963 | 1,192 | 1,383 |
| 2010 | 1,394 | 759 | 1,268 | 1,260 | 941 | 1,015 | 714 | 1,440 | 832 | 1,318 | 1,431 | 973 |
| 2011 | 1,112 | 1,205 | 1,442 | 1,356 | 633 | 1,066 | 1,236 | 1,374 | 832 | 1,063 | 1,310 | 980 |
| 2012 | 1,274 | 674 | 912 | 851 | 869 | 678 | 1,033 | 828 | 766 | 850 | 670 | 648 |
| 2013 | 512 | 261 | 464 | 444 | 281 | 191 | 363 | 265 | 812 | 408 | 907 | 386 |
| 2014 | 593 | 474 | 623 | 599 | 474 | 621 | 599 | 512 | 728 | 954 | 679 | 649 |
| 2015 | 683 | 709 | 839 | 663 | 831 | 789 | 649 | 707 | 738 | 1,200 | 820 | 493 |
| 2016 | 737 | 401 | 410 | 352 | 614 | 454 | 406 | 499 | 484 | 704 | 377 | 391 |
| 2017 | 348 | 628 | 417 | 372 | 506 | 227 | 561 | 268 | 550 | 449 | 333 | 352 |
| 2018 | 445 | 474 | 683 | 202 | 130 | 419 | 518 | 388 | 537 | 476 | 610 | 480 |
| 2019 | 425 | 572 | 456 | 469 | 449 | 436 | 197 | 542 | 385 | 634 | 528 | 862 |
| 2020 | 472 | 985 | 387 | 688 | 479 | 411 | 592 | 237 | 339 | 346 | 337 | 470 |
| 2021 | 316 | 345 | 304 | 273 | 344 | 307 | 294 | 321 | 320 | 371 | 395 | 208 |
| 2022 | 449 | 382 | 577 | 534 | 584 | 760 | 274 | 432 | 158 | 511 | 594 | 370 |
| 2023 | 400 | 529 | 418 | 378 | 462 | 163 | 266 | 453 | 398 | 366 | 644 | 607 |
| 2024 | 334 | |||||||||||
| - = No Data Reported; -- = Not Applicable; NA = Not Available; W = Withheld to avoid disclosure of individual company data. |
| Release Date: 3/29/2024 |
| Next Release Date: 4/30/2024 |