|
Download Data (XLS File) |
|
||||||||
|
||||||||
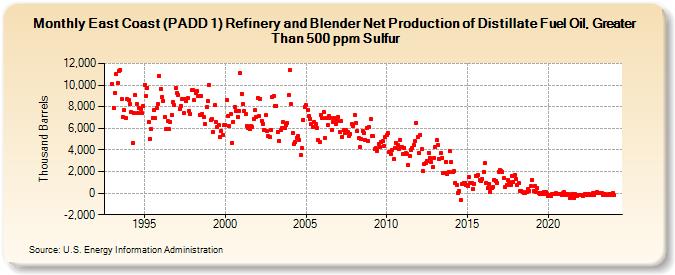
| East Coast (PADD 1) Refinery and Blender Net Production of Distillate Fuel Oil, Greater Than 500 ppm Sulfur (Thousand Barrels) | ||||||||
| Year | Jan | Feb | Mar | Apr | May | Jun | Jul | Aug | Sep | Oct | Nov | Dec |
|---|---|---|---|---|---|---|---|---|---|---|---|---|
| 1993 | 10,086 | 7,886 | 9,273 | 11,021 | 10,196 | 11,281 | 11,406 | 8,689 | 7,045 | 7,658 | 6,973 | 8,675 |
| 1994 | 8,632 | 8,214 | 7,503 | 4,633 | 7,378 | 9,091 | 8,258 | 7,441 | 7,915 | 7,785 | 7,381 | 8,065 |
| 1995 | 10,052 | 9,022 | 9,744 | 6,616 | 5,032 | 5,954 | 6,942 | 7,651 | 6,914 | 7,921 | 8,229 | 10,872 |
| 1996 | 9,680 | 8,924 | 8,564 | 7,059 | 5,906 | 6,632 | 5,897 | 6,586 | 7,256 | 8,400 | 8,139 | 9,711 |
| 1997 | 9,225 | 9,101 | 7,763 | 8,096 | 8,715 | 7,378 | 8,685 | 8,538 | 8,765 | 7,590 | 7,329 | 9,523 |
| 1998 | 9,551 | 8,578 | 9,291 | 9,417 | 9,034 | 7,226 | 9,008 | 7,326 | 7,039 | 6,397 | 7,940 | 8,507 |
| 1999 | 9,978 | 6,754 | 6,879 | 5,685 | 8,121 | 6,579 | 6,088 | 6,277 | 5,174 | 5,775 | 5,409 | 6,302 |
| 2000 | 6,329 | 8,605 | 7,154 | 6,191 | 7,321 | 4,672 | 6,607 | 7,997 | 7,575 | 7,086 | 7,637 | 11,097 |
| 2001 | 9,221 | 8,235 | 7,624 | 7,288 | 6,252 | 5,990 | 5,906 | 6,215 | 6,138 | 6,901 | 7,659 | 7,016 |
| 2002 | 8,795 | 7,152 | 8,750 | 6,709 | 6,414 | 5,880 | 7,194 | 5,726 | 5,263 | 5,223 | 5,822 | 8,897 |
| 2003 | 8,995 | 8,025 | 8,079 | 5,686 | 4,867 | 5,796 | 6,035 | 6,594 | 6,008 | 6,305 | 6,477 | 9,075 |
| 2004 | 11,387 | 8,228 | 5,597 | 4,507 | 4,701 | 5,114 | 5,248 | 4,908 | 3,561 | 4,132 | 6,812 | 8,011 |
| 2005 | 8,125 | 7,651 | 7,160 | 6,832 | 6,423 | 6,121 | 6,579 | 6,418 | 6,045 | 4,892 | 4,710 | 7,216 |
| 2006 | 6,928 | 7,528 | 5,114 | 6,939 | 6,307 | 7,102 | 6,978 | 5,858 | 6,606 | 6,955 | 6,403 | 6,701 |
| 2007 | 7,043 | 5,662 | 6,719 | 5,220 | 5,830 | 5,570 | 5,816 | 5,645 | 5,311 | 5,476 | 6,397 | 6,250 |
| 2008 | 7,258 | 6,498 | 5,719 | 5,068 | 4,265 | 5,048 | 5,754 | 5,555 | 4,920 | 6,017 | 4,867 | 6,141 |
| 2009 | 6,830 | 5,298 | 5,243 | 4,126 | 4,147 | 3,927 | 4,578 | 4,258 | 4,710 | 4,788 | 4,363 | 5,157 |
| 2010 | 5,340 | 5,544 | 3,773 | 3,617 | 4,036 | 3,154 | 4,159 | 4,673 | 4,408 | 4,109 | 4,923 | 4,274 |
| 2011 | 3,596 | 4,205 | 3,688 | 3,603 | 2,603 | 3,448 | 3,993 | 4,215 | 4,410 | 4,792 | 6,513 | 5,232 |
| 2012 | 3,729 | 5,389 | 4,079 | 2,004 | 2,722 | 2,771 | 3,009 | 3,743 | 3,258 | 2,898 | 2,373 | 3,224 |
| 2013 | 4,300 | 4,881 | 4,446 | 3,135 | 3,681 | 3,267 | 1,829 | 1,885 | 2,915 | 1,740 | 1,996 | 3,871 |
| 2014 | 2,891 | 1,975 | 2,041 | 965 | 789 | 27 | 164 | -661 | 854 | 968 | 938 | 768 |
| 2015 | 702 | 1,507 | 902 | 912 | 382 | 885 | 1,612 | 1,578 | 1,678 | 1,195 | 1,131 | 1,321 |
| 2016 | 2,000 | 2,765 | 916 | 461 | 863 | 138 | 516 | 583 | 1,222 | 1,078 | 936 | 1,997 |
| 2017 | 2,109 | 2,091 | 1,961 | 1,419 | 611 | 745 | 1,215 | 1,018 | 773 | 1,613 | 1,057 | 1,717 |
| 2018 | 1,317 | 747 | 979 | 151 | 211 | 118 | 27 | 32 | 135 | 362 | 228 | 634 |
| 2019 | 1,191 | 235 | 699 | 122 | 427 | -18 | -51 | 48 | -89 | 106 | 120 | -82 |
| 2020 | -262 | -196 | -245 | -64 | -64 | -56 | -17 | -118 | -74 | -69 | -148 | -33 |
| 2021 | 92 | -171 | -95 | -85 | -426 | -248 | -45 | -413 | -53 | -232 | -140 | -192 |
| 2022 | -159 | -169 | -285 | -85 | -105 | -174 | -108 | -159 | -163 | -27 | -157 | 22 |
| 2023 | 100 | 3 | 38 | 33 | -21 | -151 | -84 | -129 | -163 | -125 | -115 | -173 |
| 2024 | 0 | |||||||||||
| - = No Data Reported; -- = Not Applicable; NA = Not Available; W = Withheld to avoid disclosure of individual company data. |
| Release Date: 3/29/2024 |
| Next Release Date: 4/30/2024 |