|
Download Data (XLS File) |
|
||||||||
|
||||||||
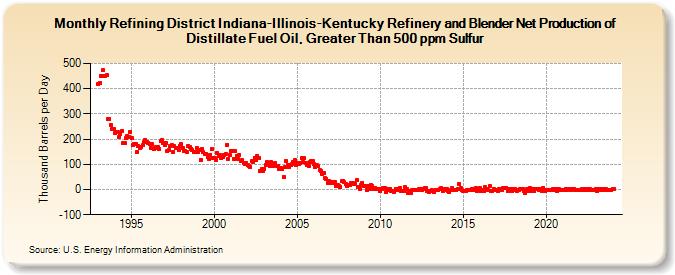
| Refining District Indiana-Illinois-Kentucky Refinery and Blender Net Production of Distillate Fuel Oil, Greater Than 500 ppm Sulfur (Thousand Barrels per Day) | ||||||||
| Year | Jan | Feb | Mar | Apr | May | Jun | Jul | Aug | Sep | Oct | Nov | Dec |
|---|---|---|---|---|---|---|---|---|---|---|---|---|
| 1993 | 418 | 423 | 450 | 473 | 450 | 451 | 455 | 280 | 280 | 256 | 242 | 239 |
| 1994 | 224 | 227 | 228 | 209 | 222 | 233 | 186 | 185 | 206 | 213 | 210 | 229 |
| 1995 | 203 | 176 | 180 | 182 | 147 | 173 | 163 | 167 | 175 | 189 | 196 | 189 |
| 1996 | 186 | 179 | 166 | 179 | 159 | 165 | 167 | 170 | 162 | 191 | 196 | 183 |
| 1997 | 175 | 184 | 151 | 157 | 171 | 176 | 148 | 172 | 165 | 163 | 157 | 174 |
| 1998 | 179 | 163 | 154 | 152 | 150 | 172 | 170 | 162 | 156 | 150 | 150 | 165 |
| 1999 | 150 | 155 | 119 | 161 | 147 | 142 | 141 | 129 | 123 | 138 | 160 | 125 |
| 2000 | 124 | 117 | 145 | 131 | 135 | 125 | 128 | 138 | 140 | 178 | 122 | 137 |
| 2001 | 152 | 152 | 123 | 152 | 132 | 122 | 136 | 115 | 116 | 105 | 102 | 106 |
| 2002 | 96 | 93 | 90 | 112 | 110 | 126 | 119 | 131 | 125 | 74 | 81 | 74 |
| 2003 | 83 | 99 | 108 | 105 | 92 | 109 | 92 | 103 | 104 | 93 | 94 | 82 |
| 2004 | 86 | 81 | 50 | 88 | 113 | 99 | 88 | 98 | 100 | 111 | 116 | 99 |
| 2005 | 104 | 102 | 106 | 125 | 109 | 124 | 107 | 97 | 95 | 109 | 112 | 112 |
| 2006 | 102 | 90 | 96 | 95 | 76 | 75 | 63 | 64 | 44 | 41 | 25 | 32 |
| 2007 | 25 | 29 | 26 | 28 | 14 | 16 | 14 | 8 | 32 | 33 | 28 | 21 |
| 2008 | 12 | 17 | 17 | 25 | 27 | 21 | 22 | 37 | 8 | 2 | 18 | 27 |
| 2009 | 15 | 14 | -1 | 13 | 3 | 18 | 12 | 3 | 5 | 2 | 2 | 1 |
| 2010 | -5 | 4 | 7 | 5 | -11 | 0 | 4 | 3 | -6 | -6 | -10 | 3 |
| 2011 | -2 | 4 | 7 | -4 | -4 | -6 | 9 | 2 | -13 | -7 | -15 | -2 |
| 2012 | -3 | -1 | -3 | -1 | 1 | 1 | -2 | 4 | 5 | 5 | -4 | -8 |
| 2013 | -6 | -2 | -5 | -8 | -2 | 0 | -2 | 2 | 6 | -4 | 0 | 2 |
| 2014 | 1 | -4 | -9 | -1 | 6 | -2 | -1 | -2 | 2 | 21 | 5 | -3 |
| 2015 | -4 | -6 | -4 | 0 | -2 | -2 | 2 | -3 | 2 | 5 | -6 | 3 |
| 2016 | 5 | -5 | -1 | -7 | 8 | 1 | -3 | 12 | -5 | -5 | 2 | 0 |
| 2017 | -2 | -4 | 2 | 1 | -1 | 6 | 6 | 7 | -4 | 2 | 1 | -4 |
| 2018 | 4 | 4 | -2 | -4 | -1 | 3 | 4 | 1 | -4 | -12 | 1 | -4 |
| 2019 | 6 | -5 | 1 | -6 | 2 | 1 | 2 | -1 | 1 | -4 | 7 | -7 |
| 2020 | 0 | -2 | -1 | 0 | -3 | 3 | -1 | 3 | -5 | 2 | -1 | 0 |
| 2021 | -3 | -1 | 3 | -2 | 1 | 1 | -1 | 1 | 3 | -2 | 0 | 0 |
| 2022 | -3 | 0 | 1 | -2 | 2 | 0 | 4 | -2 | 1 | -1 | -1 | 0 |
| 2023 | 3 | -5 | 2 | 2 | 0 | 4 | -2 | 1 | -2 | -1 | 0 | -2 |
| 2024 | 3 | |||||||||||
| - = No Data Reported; -- = Not Applicable; NA = Not Available; W = Withheld to avoid disclosure of individual company data. |
| Release Date: 3/29/2024 |
| Next Release Date: 4/30/2024 |