|
Download Data (XLS File) |
|
||||||||
|
||||||||
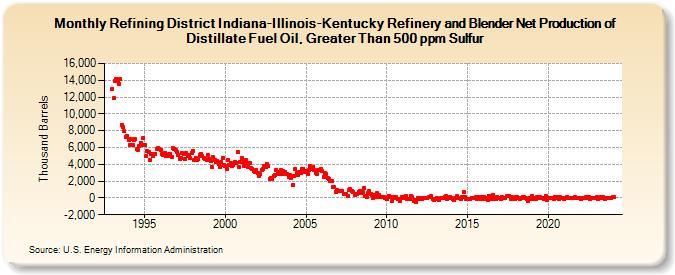
| Refining District Indiana-Illinois-Kentucky Refinery and Blender Net Production of Distillate Fuel Oil, Greater Than 500 ppm Sulfur (Thousand Barrels) | ||||||||
| Year | Jan | Feb | Mar | Apr | May | Jun | Jul | Aug | Sep | Oct | Nov | Dec |
|---|---|---|---|---|---|---|---|---|---|---|---|---|
| 1993 | 12,969 | 11,836 | 13,961 | 14,190 | 13,950 | 13,524 | 14,118 | 8,674 | 8,411 | 7,929 | 7,267 | 7,398 |
| 1994 | 6,952 | 6,345 | 7,057 | 6,262 | 6,882 | 6,978 | 5,772 | 5,726 | 6,165 | 6,592 | 6,302 | 7,098 |
| 1995 | 6,295 | 4,930 | 5,580 | 5,462 | 4,564 | 5,186 | 5,039 | 5,171 | 5,242 | 5,851 | 5,883 | 5,844 |
| 1996 | 5,752 | 5,194 | 5,137 | 5,356 | 4,937 | 4,935 | 5,189 | 5,257 | 4,850 | 5,924 | 5,876 | 5,670 |
| 1997 | 5,418 | 5,138 | 4,684 | 4,720 | 5,292 | 5,284 | 4,590 | 5,319 | 4,956 | 5,053 | 4,699 | 5,395 |
| 1998 | 5,554 | 4,554 | 4,784 | 4,557 | 4,641 | 5,148 | 5,276 | 5,017 | 4,694 | 4,636 | 4,514 | 5,116 |
| 1999 | 4,637 | 4,341 | 3,680 | 4,837 | 4,553 | 4,271 | 4,357 | 4,003 | 3,703 | 4,287 | 4,800 | 3,881 |
| 2000 | 3,836 | 3,403 | 4,497 | 3,939 | 4,193 | 3,754 | 3,975 | 4,267 | 4,191 | 5,512 | 3,647 | 4,238 |
| 2001 | 4,719 | 4,260 | 3,806 | 4,562 | 4,102 | 3,649 | 4,209 | 3,572 | 3,469 | 3,259 | 3,073 | 3,298 |
| 2002 | 2,962 | 2,614 | 2,805 | 3,374 | 3,419 | 3,783 | 3,696 | 4,070 | 3,744 | 2,280 | 2,419 | 2,283 |
| 2003 | 2,578 | 2,758 | 3,340 | 3,137 | 2,843 | 3,283 | 2,849 | 3,204 | 3,123 | 2,875 | 2,832 | 2,544 |
| 2004 | 2,672 | 2,361 | 1,556 | 2,629 | 3,497 | 2,984 | 2,720 | 3,047 | 3,005 | 3,440 | 3,471 | 3,058 |
| 2005 | 3,233 | 2,844 | 3,300 | 3,763 | 3,386 | 3,733 | 3,314 | 3,009 | 2,837 | 3,373 | 3,359 | 3,471 |
| 2006 | 3,175 | 2,512 | 2,988 | 2,854 | 2,367 | 2,252 | 1,967 | 1,974 | 1,317 | 1,285 | 751 | 984 |
| 2007 | 786 | 825 | 801 | 831 | 435 | 485 | 426 | 236 | 945 | 1,020 | 835 | 652 |
| 2008 | 363 | 481 | 524 | 739 | 828 | 632 | 695 | 1,132 | 241 | 56 | 536 | 822 |
| 2009 | 454 | 386 | -25 | 378 | 79 | 544 | 385 | 83 | 160 | 49 | 63 | 22 |
| 2010 | -162 | 101 | 203 | 146 | -351 | -11 | 128 | 94 | -172 | -176 | -309 | 92 |
| 2011 | -60 | 121 | 225 | -106 | -131 | -184 | 270 | 66 | -389 | -216 | -455 | -56 |
| 2012 | -81 | -26 | -84 | -42 | 23 | 29 | -70 | 121 | 144 | 168 | -108 | -234 |
| 2013 | -184 | -62 | -167 | -252 | -69 | -7 | -61 | 52 | 177 | -110 | 4 | 69 |
| 2014 | 38 | -101 | -280 | -43 | 189 | -52 | -20 | -71 | 49 | 656 | 144 | -88 |
| 2015 | -137 | -181 | -134 | -8 | -61 | -56 | 64 | -88 | 67 | 163 | -187 | 84 |
| 2016 | 142 | -148 | -20 | -215 | 261 | 42 | -84 | 359 | -162 | -155 | 53 | 7 |
| 2017 | -49 | -109 | 53 | 16 | -18 | 182 | 198 | 224 | -113 | 58 | 33 | -114 |
| 2018 | 121 | 123 | -51 | -108 | -46 | 79 | 122 | 32 | -113 | -371 | 40 | -120 |
| 2019 | 185 | -128 | 17 | -178 | 77 | 30 | 73 | -22 | 32 | -117 | 207 | -217 |
| 2020 | -14 | -46 | -45 | -1 | -97 | 91 | -41 | 83 | -143 | 75 | -31 | 8 |
| 2021 | -94 | -19 | 80 | -54 | 36 | 25 | -26 | 21 | 95 | -54 | 9 | -8 |
| 2022 | -79 | 7 | 16 | -55 | 54 | 9 | 111 | -71 | 17 | -27 | -38 | 8 |
| 2023 | 87 | -130 | 47 | 60 | 14 | 134 | -77 | 43 | -53 | -35 | 9 | -70 |
| 2024 | 100 | |||||||||||
| - = No Data Reported; -- = Not Applicable; NA = Not Available; W = Withheld to avoid disclosure of individual company data. |
| Release Date: 3/29/2024 |
| Next Release Date: 4/30/2024 |