|
Download Data (XLS File) |
|
||||||||
|
||||||||
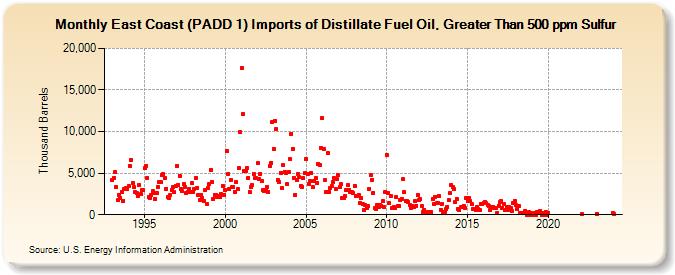
| East Coast (PADD 1) Imports of Distillate Fuel Oil, Greater Than 500 ppm Sulfur (Thousand Barrels) | ||||||||
| Year | Jan | Feb | Mar | Apr | May | Jun | Jul | Aug | Sep | Oct | Nov | Dec |
|---|---|---|---|---|---|---|---|---|---|---|---|---|
| 1993 | 4,150 | 4,438 | 5,130 | 3,350 | 1,739 | 2,364 | 2,055 | 2,729 | 1,691 | 3,093 | 3,272 | 3,098 |
| 1994 | 3,394 | 5,874 | 6,621 | 3,823 | 3,310 | 2,695 | 2,554 | 2,254 | 3,589 | 2,469 | 2,967 | 2,923 |
| 1995 | 5,613 | 5,917 | 4,448 | 2,171 | 2,007 | 2,311 | 2,813 | 2,647 | 1,909 | 2,596 | 3,337 | 3,953 |
| 1996 | 3,877 | 4,786 | 4,872 | 4,441 | 3,122 | 2,114 | 2,020 | 2,369 | 2,995 | 3,332 | 2,709 | 3,459 |
| 1997 | 5,910 | 3,622 | 4,661 | 3,151 | 2,803 | 3,661 | 3,361 | 2,603 | 2,751 | 3,125 | 2,680 | 3,784 |
| 1998 | 2,699 | 3,104 | 4,429 | 3,222 | 2,368 | 1,776 | 2,349 | 2,044 | 1,648 | 2,936 | 1,335 | 3,260 |
| 1999 | 3,637 | 5,388 | 3,930 | 1,908 | 2,397 | 2,408 | 2,185 | 2,302 | 2,087 | 2,483 | 3,456 | 2,424 |
| 2000 | 2,918 | 7,688 | 4,930 | 3,032 | 4,197 | 3,288 | 3,337 | 2,756 | 3,949 | 3,067 | 5,596 | 9,896 |
| 2001 | 17,685 | 12,072 | 5,278 | 5,225 | 5,627 | 4,425 | 2,752 | 3,384 | 3,534 | 4,948 | 4,379 | 4,382 |
| 2002 | 6,210 | 4,294 | 4,926 | 4,049 | 2,929 | 2,876 | 2,958 | 3,386 | 2,786 | 5,883 | 6,274 | 11,134 |
| 2003 | 7,909 | 11,321 | 10,254 | 4,171 | 3,931 | 5,065 | 3,186 | 5,928 | 5,194 | 5,050 | 3,663 | 5,116 |
| 2004 | 6,660 | 9,697 | 7,955 | 4,451 | 2,417 | 4,176 | 4,918 | 4,492 | 3,491 | 3,371 | 4,406 | 5,014 |
| 2005 | 6,690 | 4,855 | 3,669 | 4,052 | 5,000 | 3,337 | 4,085 | 4,408 | 3,848 | 6,132 | 6,024 | 8,070 |
| 2006 | 11,628 | 7,929 | 4,124 | 2,715 | 7,367 | 2,719 | 3,189 | 3,462 | 3,962 | 4,399 | 3,124 | 4,294 |
| 2007 | 4,739 | 3,320 | 3,663 | 1,979 | 1,979 | 2,217 | 3,027 | 3,596 | 2,966 | 2,710 | 2,759 | 2,606 |
| 2008 | 3,482 | 2,310 | 2,304 | 2,373 | 1,357 | 1,988 | 1,250 | 552 | 1,127 | 852 | 1,087 | 3,127 |
| 2009 | 4,781 | 4,213 | 2,645 | 777 | 728 | 1,184 | 934 | 1,163 | 1,108 | 1,614 | 911 | 2,749 |
| 2010 | 7,178 | 2,598 | 1,418 | 2,212 | 773 | 932 | 771 | 2,149 | 1,089 | 1,060 | 1,786 | 1,941 |
| 2011 | 4,261 | 2,699 | 1,665 | 1,684 | 1,557 | 1,158 | 759 | 1,079 | 972 | 1,627 | 1,082 | 2,402 |
| 2012 | 1,781 | 1,883 | 1,000 | 376 | 615 | 349 | 286 | 227 | 302 | 343 | 1,900 | 1,346 |
| 2013 | 2,163 | 1,385 | 1,436 | 2,218 | 612 | 1,320 | 346 | 357 | 698 | 936 | 1,774 | 2,557 |
| 2014 | 3,602 | 3,347 | 3,086 | 1,582 | 1,914 | 676 | 531 | 877 | 949 | 1,082 | 835 | 1,955 |
| 2015 | 1,682 | 1,958 | 1,602 | 1,238 | 729 | 647 | 575 | 977 | 666 | 548 | 1,310 | 1,256 |
| 2016 | 1,393 | 1,586 | 1,359 | 1,171 | 999 | 548 | 883 | 963 | 833 | 779 | 247 | 1,101 |
| 2017 | 1,483 | 1,610 | 810 | 1,311 | 548 | 978 | 590 | 871 | 848 | 437 | 1,383 | 1,707 |
| 2018 | 1,111 | 655 | 1,050 | 237 | 190 | 196 | 254 | 486 | 10 | 11 | 278 | 264 |
| 2019 | 21 | 11 | 197 | 2 | 302 | 340 | 490 | 13 | 159 | 12 | 367 | 7 |
| 2020 | 263 | |||||||||||
| 2022 | 62 | |||||||||||
| 2023 | 131 | |||||||||||
| 2024 | 252 | |||||||||||
| - = No Data Reported; -- = Not Applicable; NA = Not Available; W = Withheld to avoid disclosure of individual company data. |
| Release Date: 3/29/2024 |
| Next Release Date: 4/30/2024 |