|
Download Data (XLS File) |
|
||||||||
|
||||||||
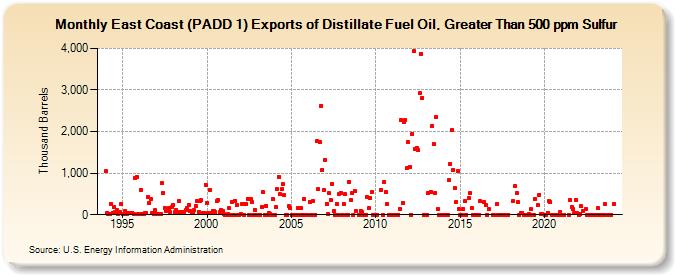
| East Coast (PADD 1) Exports of Distillate Fuel Oil, Greater Than 500 ppm Sulfur (Thousand Barrels) | ||||||||
| Year | Jan | Feb | Mar | Apr | May | Jun | Jul | Aug | Sep | Oct | Nov | Dec |
|---|---|---|---|---|---|---|---|---|---|---|---|---|
| 1994 | 1,042 | 49 | 22 | 20 | 264 | 51 | 186 | 63 | 106 | 20 | 70 | 259 |
| 1995 | 6 | 28 | 95 | 28 | 31 | 42 | 37 | 50 | 18 | 894 | 908 | 13 |
| 1996 | 10 | 601 | 28 | 28 | 37 | 30 | 434 | 280 | 388 | 33 | 29 | 111 |
| 1997 | 22 | 18 | 26 | 23 | 753 | 511 | 157 | 82 | 145 | 167 | 54 | 197 |
| 1998 | 245 | 59 | 116 | 71 | 319 | 58 | 63 | 60 | 55 | 111 | 169 | 243 |
| 1999 | 91 | 54 | 71 | 112 | 210 | 323 | 67 | 335 | 346 | 53 | 43 | 724 |
| 2000 | 291 | 38 | 601 | 42 | 100 | 98 | 66 | 334 | 346 | 58 | 114 | 97 |
| 2001 | 13 | 1 | 0 | 24 | 151 | 4 | 313 | 3 | 336 | 233 | 3 | 2 |
| 2002 | 19 | 256 | 1 | 253 | 262 | 384 | 3 | 374 | 294 | 3 | 125 | 2 |
| 2003 | 2 | 2 | 5 | 192 | 540 | 3 | 218 | 2 | 44 | 23 | 0 | 373 |
| 2004 | 1 | 191 | 615 | 914 | 488 | 607 | 727 | 463 | 0 | 0 | 199 | 151 |
| 2005 | 1 | 1 | 1 | 1 | 168 | 0 | 152 | 1 | 386 | 0 | 0 | |
| 2006 | 312 | 1 | 325 | 1 | 1 | 1,769 | 608 | 1,745 | 2,623 | 1,087 | 597 | |
| 2007 | 1,326 | 264 | 21 | 516 | 351 | 746 | 84 | 3 | 266 | 0 | 487 | 531 |
| 2008 | 0 | 251 | 489 | 0 | 1 | 792 | 343 | 526 | 0 | 559 | 83 | |
| 2009 | 1 | 92 | 57 | 0 | 0 | 0 | 430 | 155 | 398 | 546 | 1 | |
| 2010 | 3 | 1 | 606 | 0 | 794 | 548 | 259 | 1 | 0 | 0 | ||
| 2011 | 0 | 1 | 0 | 1 | 1 | 149 | 2,283 | 290 | 2,228 | 2,287 | 1,112 | 1,746 |
| 2012 | 1,154 | 0 | 1,948 | 3,937 | 1,575 | 1,606 | 1,562 | 2,918 | 3,872 | 2,817 | 1 | 1 |
| 2013 | 1 | 533 | 555 | 2,136 | 1,707 | 533 | 2,349 | 139 | 2 | 1 | 2 | |
| 2014 | 1 | 1 | 1 | 0 | 827 | 1,224 | 2,045 | 1,077 | 631 | 302 | 1,049 | 126 |
| 2015 | 0 | 0 | 138 | 319 | 0 | 395 | 512 | 152 | 1 | 0 | ||
| 2016 | 0 | 330 | 301 | 227 | 0 | 136 | 0 | |||||
| 2017 | 1 | 262 | 0 | 0 | 0 | 0 | 0 | 0 | 0 | 0 | ||
| 2018 | 320 | 680 | 527 | 298 | 0 | 31 | 47 | 0 | 0 | |||
| 2019 | 0 | 6 | 130 | 0 | 0 | 388 | 223 | 486 | 16 | 20 | ||
| 2020 | 0 | 1 | 51 | 322 | 303 | 0 | 1 | 2 | 0 | 59 | ||
| 2021 | 0 | 0 | 3 | 1 | 355 | 193 | 134 | 48 | 355 | 42 | ||
| 2022 | 4 | 7 | 199 | 94 | 140 | 4 | 1 | 1 | 1 | 1 | 1 | |
| 2023 | 1 | 1 | 150 | 2 | 1 | 1 | 0 | 250 | 1 | 0 | ||
| - = No Data Reported; -- = Not Applicable; NA = Not Available; W = Withheld to avoid disclosure of individual company data. |
| Release Date: 3/29/2024 |
| Next Release Date: 4/30/2024 |