|
Download Data (XLS File) |
|
||||||||
|
||||||||
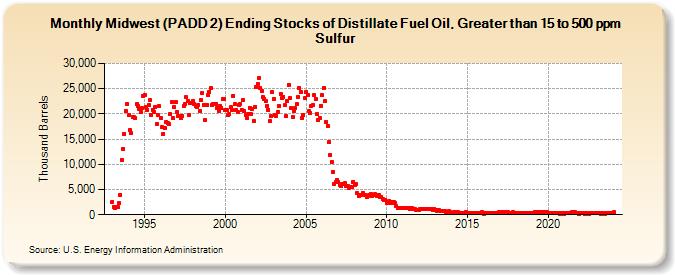
| Midwest (PADD 2) Ending Stocks of Distillate Fuel Oil, Greater than 15 to 500 ppm Sulfur (Thousand Barrels) | ||||||||
| Year | Jan | Feb | Mar | Apr | May | Jun | Jul | Aug | Sep | Oct | Nov | Dec |
|---|---|---|---|---|---|---|---|---|---|---|---|---|
| 1993 | 2,544 | 1,584 | 1,410 | 1,519 | 1,604 | 2,229 | 4,007 | 10,935 | 13,112 | 16,098 | 20,559 | 21,879 |
| 1994 | 19,728 | 16,775 | 16,191 | 19,390 | 19,288 | 19,202 | 21,936 | 21,639 | 20,985 | 20,387 | 21,104 | 23,646 |
| 1995 | 23,808 | 21,463 | 20,860 | 21,691 | 22,731 | 19,878 | 20,841 | 20,400 | 21,402 | 18,038 | 19,762 | 21,471 |
| 1996 | 19,214 | 17,332 | 16,060 | 17,228 | 18,442 | 18,277 | 17,916 | 19,925 | 22,405 | 19,150 | 21,348 | 22,399 |
| 1997 | 20,380 | 19,549 | 19,588 | 19,159 | 19,628 | 21,622 | 21,973 | 23,321 | 22,566 | 19,742 | 22,135 | 22,230 |
| 1998 | 22,546 | 22,002 | 21,645 | 21,306 | 21,810 | 20,531 | 22,740 | 24,163 | 21,768 | 18,762 | 21,732 | 23,720 |
| 1999 | 24,396 | 25,052 | 21,816 | 21,938 | 22,059 | 22,031 | 21,247 | 20,637 | 21,628 | 21,220 | 22,967 | 22,874 |
| 2000 | 20,738 | 20,820 | 19,802 | 20,006 | 21,291 | 20,865 | 23,648 | 21,955 | 20,810 | 20,295 | 21,770 | 21,989 |
| 2001 | 20,859 | 22,684 | 20,527 | 19,777 | 19,258 | 20,073 | 21,229 | 19,913 | 20,890 | 18,678 | 21,439 | 25,362 |
| 2002 | 25,989 | 27,035 | 25,120 | 24,606 | 23,344 | 23,015 | 22,472 | 21,638 | 20,804 | 18,523 | 19,541 | 24,282 |
| 2003 | 23,048 | 19,697 | 19,655 | 20,464 | 21,579 | 23,943 | 23,068 | 23,409 | 21,675 | 19,578 | 22,497 | 25,781 |
| 2004 | 23,147 | 21,096 | 19,410 | 20,484 | 21,111 | 21,878 | 23,375 | 25,096 | 24,366 | 19,106 | 19,772 | 23,101 |
| 2005 | 24,335 | 23,721 | 20,591 | 20,264 | 21,581 | 21,766 | 23,685 | 22,975 | 19,978 | 18,793 | 19,265 | 21,639 |
| 2006 | 23,666 | 25,188 | 22,511 | 18,430 | 17,604 | 14,328 | 11,933 | 10,399 | 8,481 | 6,163 | 6,408 | 6,934 |
| 2007 | 6,531 | 5,891 | 5,752 | 6,168 | 6,139 | 6,207 | 5,610 | 5,639 | 5,257 | 5,437 | 5,569 | 6,533 |
| 2008 | 5,937 | 6,137 | 4,233 | 3,797 | 3,864 | 3,962 | 4,335 | 3,865 | 3,942 | 3,545 | 3,725 | 3,999 |
| 2009 | 4,118 | 3,775 | 3,920 | 4,022 | 3,863 | 3,730 | 3,853 | 3,513 | 3,573 | 3,052 | 2,867 | 2,991 |
| 2010 | 2,356 | 2,438 | 2,695 | 2,268 | 2,469 | 2,542 | 2,282 | 1,685 | 1,235 | 1,301 | 1,276 | 1,243 |
| 2011 | 1,339 | 1,408 | 1,274 | 1,320 | 1,311 | 1,114 | 1,313 | 1,275 | 1,055 | 1,130 | 922 | 995 |
| 2012 | 970 | 1,105 | 1,153 | 1,065 | 1,162 | 1,170 | 1,047 | 1,126 | 1,074 | 1,086 | 979 | 1,172 |
| 2013 | 975 | 766 | 927 | 843 | 767 | 734 | 701 | 646 | 576 | 623 | 660 | 538 |
| 2014 | 403 | 426 | 509 | 474 | 462 | 513 | 336 | 392 | 402 | 418 | 414 | 497 |
| 2015 | 424 | 390 | 396 | 423 | 322 | 256 | 311 | 372 | 396 | 382 | 316 | 503 |
| 2016 | 236 | 390 | 260 | 296 | 353 | 352 | 331 | 391 | 439 | 289 | 394 | 450 |
| 2017 | 396 | 410 | 461 | 378 | 495 | 410 | 479 | 360 | 384 | 419 | 466 | 324 |
| 2018 | 334 | 310 | 245 | 273 | 261 | 299 | 375 | 306 | 314 | 399 | 320 | 382 |
| 2019 | 380 | 326 | 554 | 482 | 550 | 459 | 458 | 483 | 608 | 387 | 478 | 480 |
| 2020 | 388 | 419 | 429 | 388 | 334 | 372 | 327 | 291 | 281 | 196 | 277 | 302 |
| 2021 | 217 | 257 | 300 | 263 | 359 | 409 | 501 | 517 | 486 | 356 | 304 | 236 |
| 2022 | 308 | 276 | 272 | 228 | 329 | 308 | 194 | 313 | 285 | 385 | 321 | 397 |
| 2023 | 321 | 267 | 298 | 218 | 346 | 283 | 206 | 340 | 282 | 365 | 409 | 318 |
| 2024 | 344 | |||||||||||
| - = No Data Reported; -- = Not Applicable; NA = Not Available; W = Withheld to avoid disclosure of individual company data. |
| Release Date: 3/29/2024 |
| Next Release Date: 4/30/2024 |